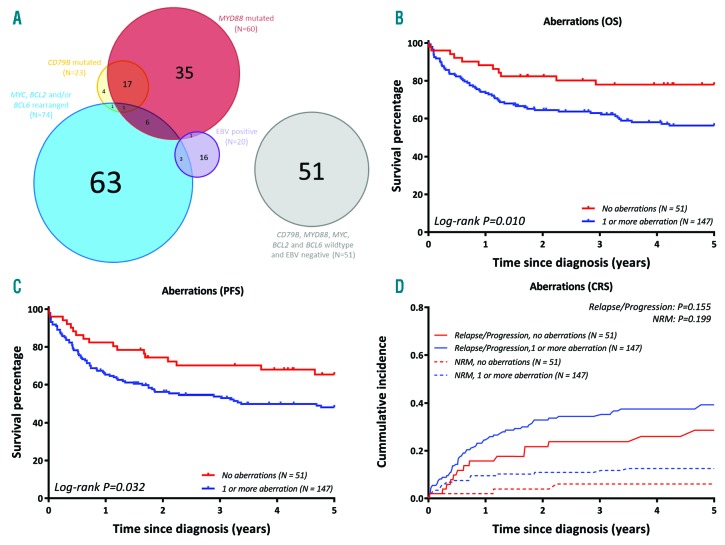
Figure 2.
Molecular characterization discriminates distinct DLBCL subgroups with prognostic impact. (A) Venn diagram demonstrating the overlap of aberrations for 198 fully analysed DLBCL. (B) DLBCL without detected aberrations showed a superior overall survival compared to DLBCL with ≥1 affected aberrations (for cases with complete aberration analysis), identifying a novel good-risk group. (C) PFS of the novel identified risk group (for cases with complete driver analysis). (D) Cumulative incidences of novel identified risk group (for cases with complete driver analysis). CRS: competing risk; PFS: progression free survival.

