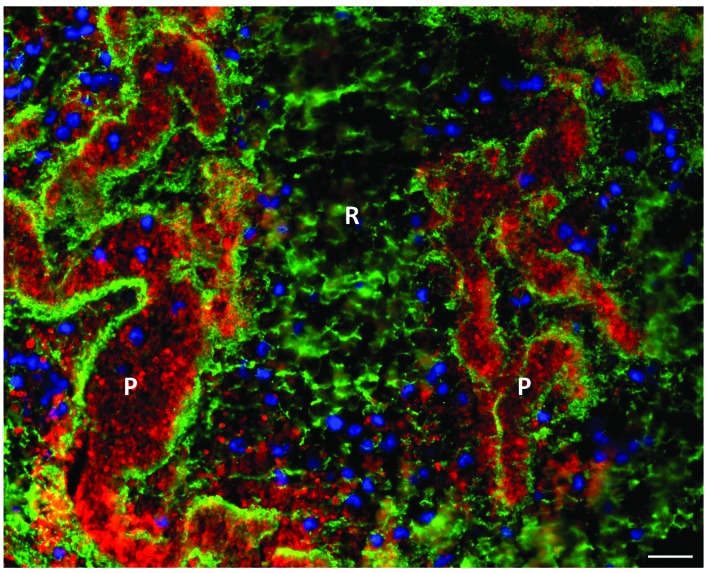
Figure 5.
Immunofluorescent overview picture of red blood cell (RBC)-rich and platelet-rich areas. Immunofluorescent analysis was used to visualize fibrin(ogen) (green), platelets (red), and nuclei (blue). RBC-rich areas consist of thin fibrin strands and RBC (not stained), whereas platelet-rich areas consist of dense fibrin structures packed with platelets. Nucleated cells were mainly found near platelet-rich areas. Scale bar = 20 mm. P: platelet-rich area; R: RBC-rich area.

