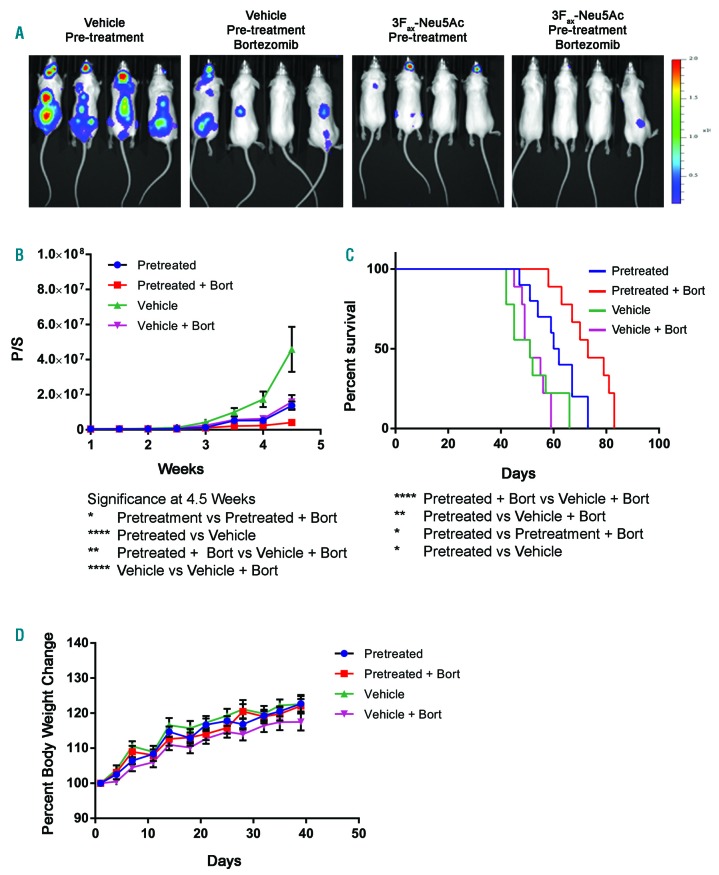
Figure 3.
Effects of 3Fax-Neu5Ac pre-treatment on MM1SHeca452 xenograft mouse models. (A) Representative bioluminescence images taken at week 4.5 showing the differences in tumor burden between treatment groups. The colored scale represents luminescence in radiance unit (p/sec/cm2/sr) with maximum and minimum values of 2x10⁶ and 1.5x10⁵, respectively. Graph lines illustrate tumor burden (B), survival (C), and body weight (D) of treatment groups. Bars represent Standard Error of Mean. The two-way ANOVA was used to determine statistical significance with Tukey’s multiple comparison post-hoc testing. *P<0.05; **P<0.01; ****P<0.0001. Bort: borte-zomib

