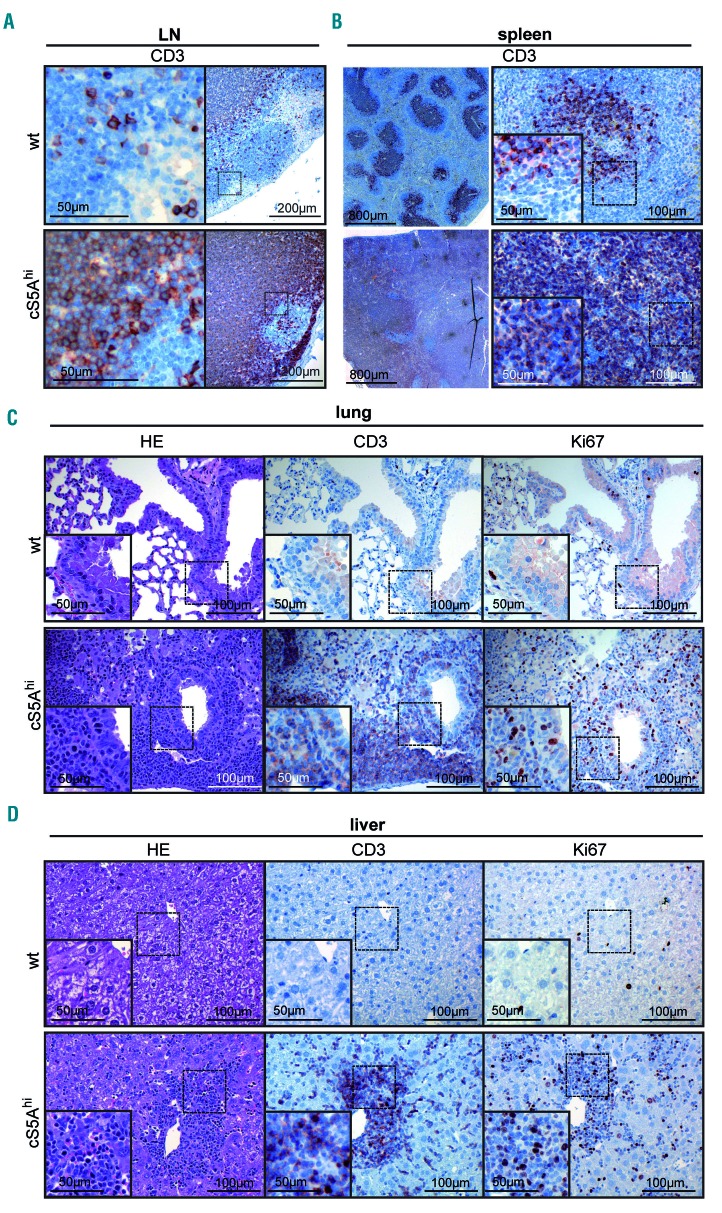
Figure 3.
Expanded CD8+ T cells infiltrate peripheral organs. (A) CD3 staining of a representative enlarged lymph node (LN) of a diseased cS5Ahi mouse and age-matched wildtype (wt) mouse LN. (B) CD3 staining on consecutive cuts of representative spleens of wt controls and diseased cS5Ahi mice. (C, D) Hematoxylin & eosin (HE) (left), CD3 (middle) and Ki67 (right) staining of consecutive sections of lung (C) and liver (D) of diseased cS5Ahi and age-matched wt mice. (A-D) Scale bars indicate 50, 100, 200, or 800 mm.

