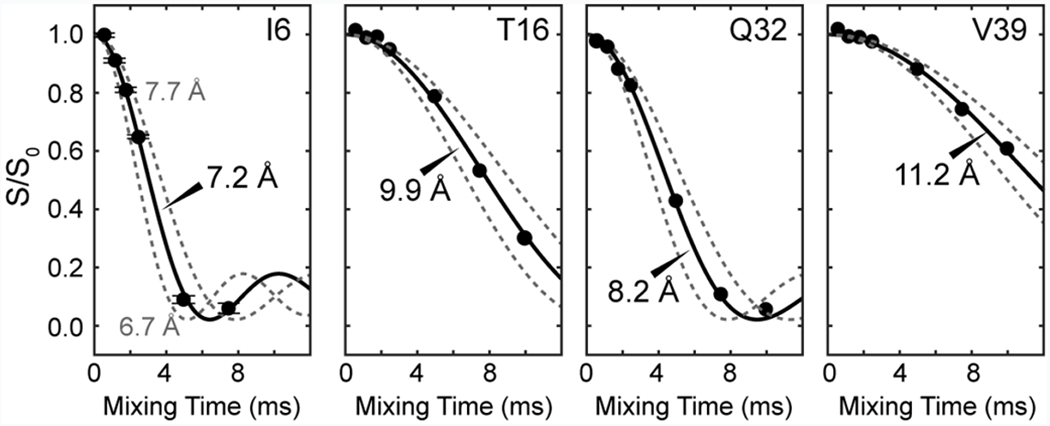
Figure 3.

HN-19F REDOR dephasing, measured under 40 kHz MAS, for representative residues of GB1. Best-fit simulations (solid lines) are shown, together with simulated curves for distances that are ±0.5 Å from the best fit (dashed lines). Residues with shorter T2 relaxation times such as I6 may have their signals disappear from some of the spectra at longer mixing times, in which case fewer REDOR intensity data points are detected. The high sensitivity of the 1H-detected spectra yielded error bars that are typically less than 0.02, which are smaller than the points in the plot, as shown for the I6 data as an example.
