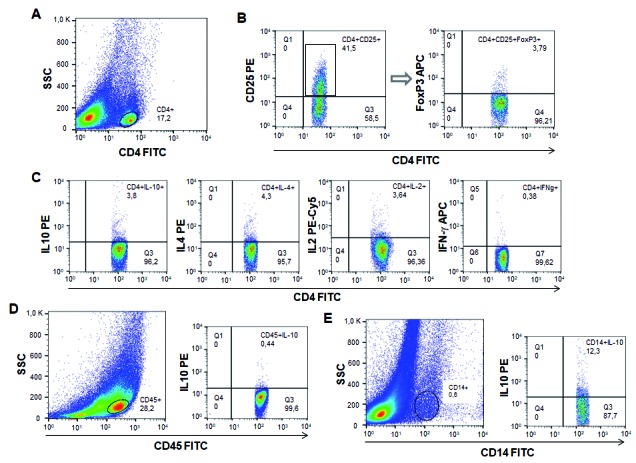
Fig. 1: representation of the gating strategy used to analyse the different subpopulations of cells. FL1/anti-CD4-FITC versus laser side-scatter (SSC) dot plot (A), CD4+CD25+FoxP3+ cells dot plots (B), cytokine producing T CD4+ lymphocytes dot plots (C), IL-10 producing CD45R/B220+ cells dot plot (D) and IL-10 producing CD14+ cells dot plot (E).