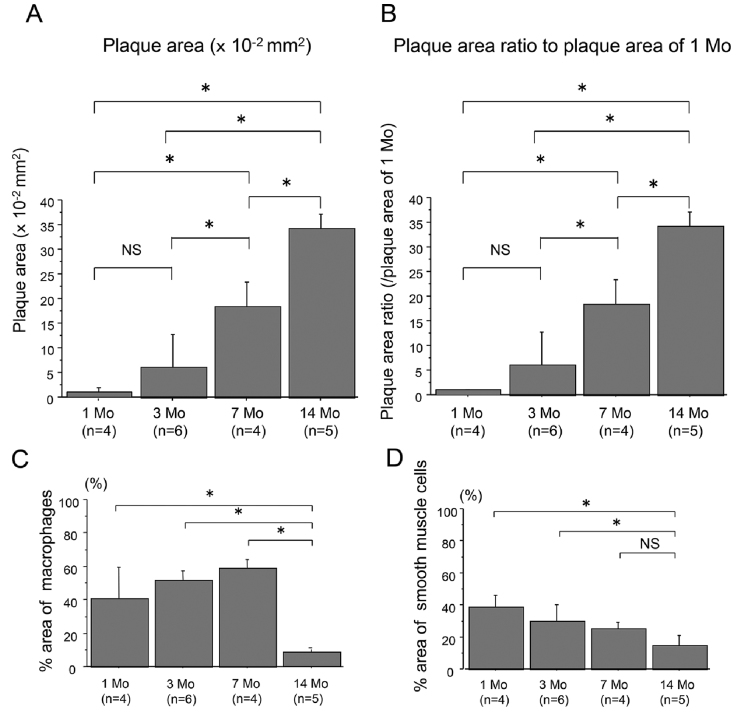
Fig. 1.
Quantitative analysis of the absolute plaque areas (A) and proportions (B) of aortic plaques of WHHLMI rabbits with aging (1, 3, 7 and 14 months, n=4 to 6), as well as % area of macrophages (C) and smooth muscle cells (D). The proportions of plaques were determined by the control values at 1 month (B). Measured values are expressed as mean±S.D. *P<0.05. Mo, months and NS, not significant.

