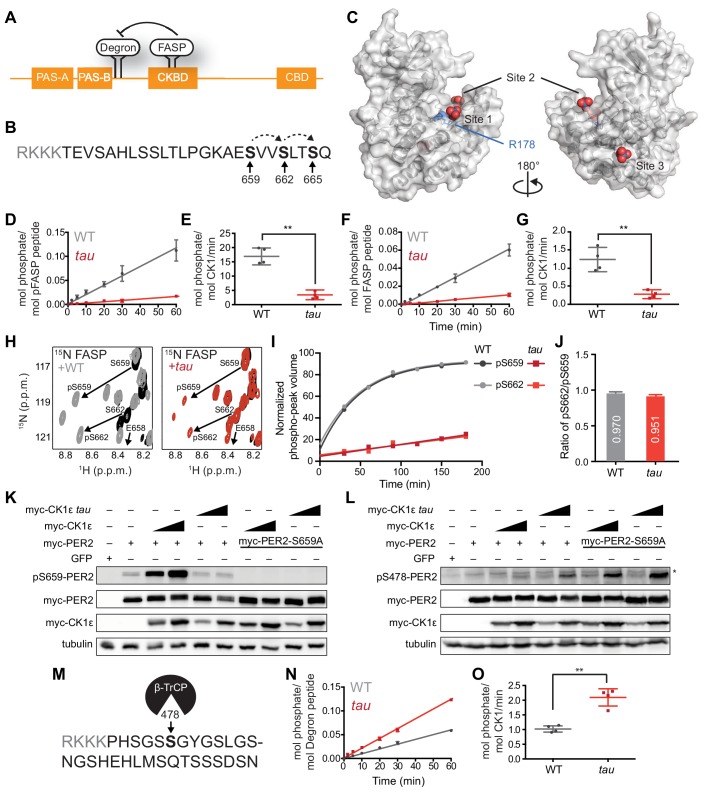
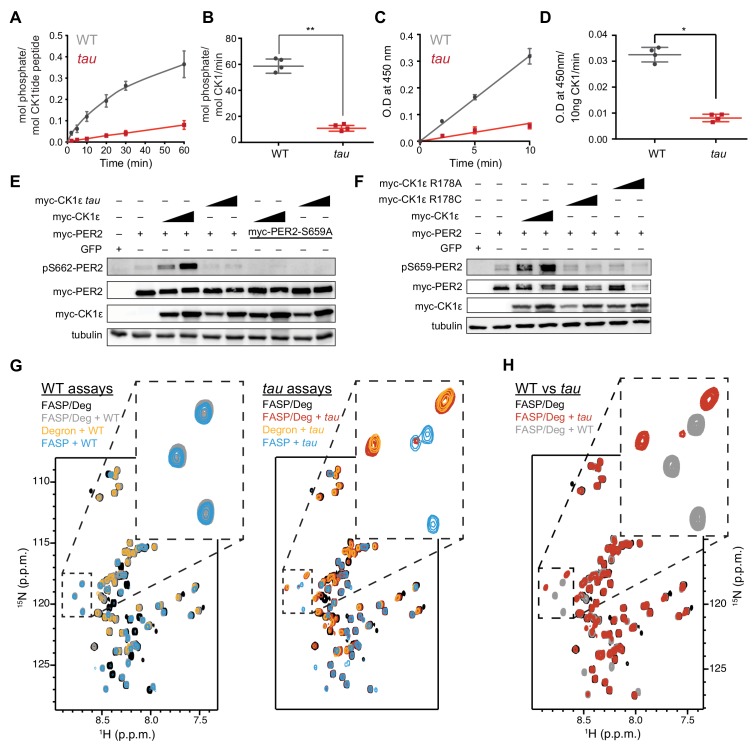
Figure 1. tau alters CK1 substrate selectivity on PER2 to enhance Degron phosphorylation.
(A) Domain map of PER2 with tandem PAS domains, Casein Kinase-binding domain (CKBD), CRY-binding domain (CBD) and CK1 phosphorylation sites. (B) Sequence of the mouse PER2 FASP peptide with the priming site (S659, bold) and two downstream phosphorylation sites (S662 and S665, bold) that are phosphorylated sequentially by CK1δ (dashed arrows). Gray, polybasic motif included for 32P kinase assay. (C) CK1δ kinase domain with three anion binding sites (PDB: 1CKJ with WO42- anions). R178, blue. D, Kinase assay with 20 nM CK1δ ΔC WT or tau on 200 µM of primed FASP peptide (pS659) (n = 4 with s.d.). (E) Phosphorylation rates on primed FASP (n = 4 with s.d.). Significance assessed by unpaired Student’s two-sided t-test: **, p<0.01. (F) Kinase assay as in D, but with 200 nM CK1δ ΔC WT or tau on 200 µM of unprimed FASP (n = 4 with s.d.). (G) Phosphorylation rates on the unprimed FASP peptide (n = 4 with s.d.). Significance assessed as above. (H) Overlaid 15N/1H HSQC spectra at 3 hr timepoint in the NMR kinase assay on 200 µM 15N FASP (black) ±1 μM WT (gray) or tau (red) CK1δ ΔC. Arrows, phospho-specific peaks corresponding to pS659 and pS662. (I) Phosphoserine peak intensities for pS659 and pS662 by WT and tau kinases from NMR kinase assay. (J) Ratio of consensus to priming activity on the FASP (pS662/pS659) in the NMR kinase assay. Errors were estimated from the standard deviation of the noise in the spectrum. (K-L) Western blot of FASP priming site, detecting pS659 (K) or the Degron, detecting pS478 (L) on mouse myc-PER2 in HEK293 cell lysates after transfection with indicated expression plasmids. Representative blot from n = 3 shown. Wedge, 10 or 50 ng of myc-CK1ε plasmid used. *, non-specific band. (M) Sequence of mouse PER2 Degron peptide with S478 (bold) and polybasic motif (gray). (N) Kinase assay with 200 nM kinase on 200 µM Degron peptide (n = 4 with s.d.). (O) Phosphorylation rates on Degron (n = 4 with s.d.). Significance assessed as above. See also Figure 1—figure supplement 1.


