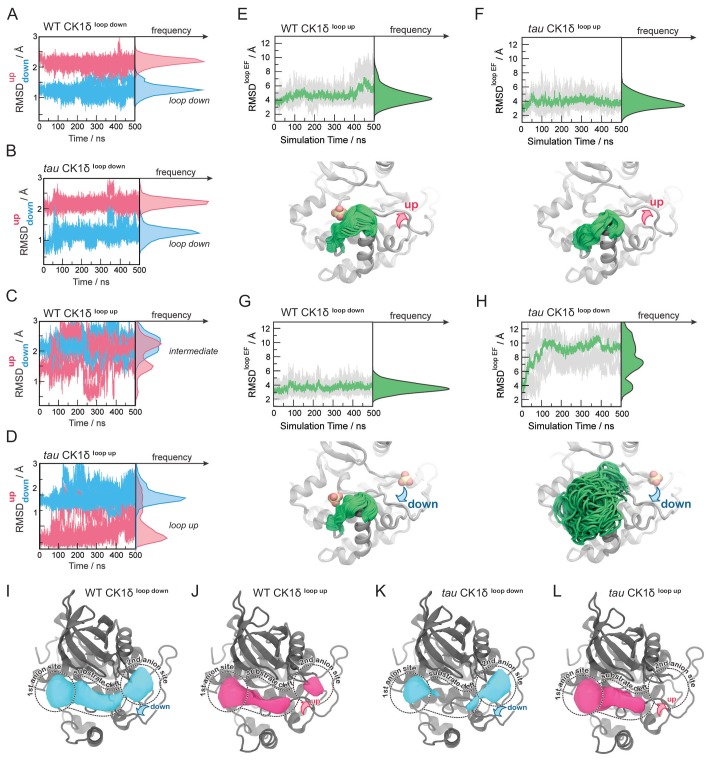
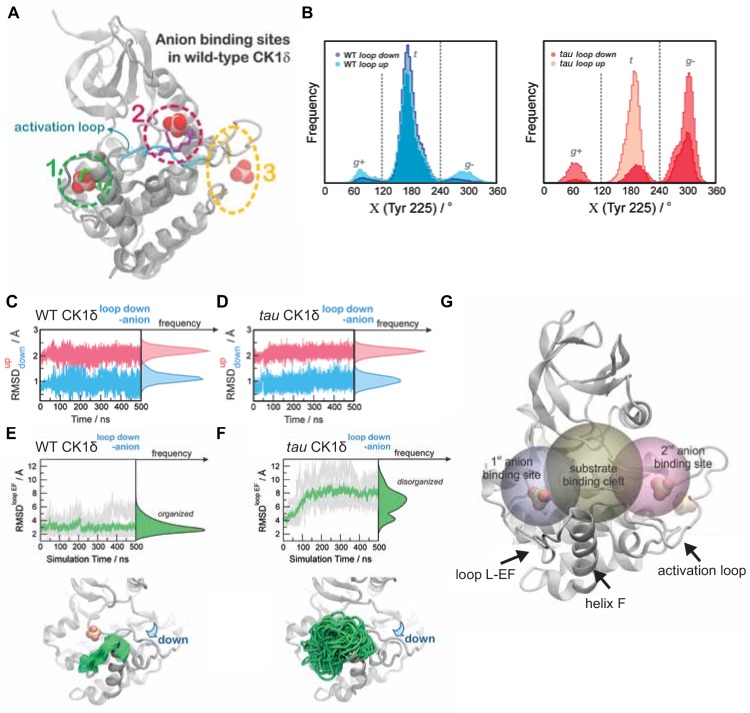
Figure 4. Probing the dynamics of CK1δ with GaMD simulations.
(A-D) Stability of the activation loop assessed by the RMSD of residues 168–175 with respect to the ‘loop down’ (RMSDdown, blue) or ‘loop up’ conformation (RMSDup, pink), as observed in the crystal structure. For each system, the RMSDs from all five MD replicas are superimposed. Panel A, WT CK1δloop down; (B) tau CK1δloop down; C, WT CK1δloop up; D, tau CK1δloop up. (E-H) Dynamics of the EF loop assessed by the RMSD of residues 213–224 with respect to the initial structure. For each system, the RMSD was calculated for individual replica (gray lines, n = 5) and then averaged (green). The molecular representations in panels E-H show the crystallographic structure of CK1δ (gray) superimposed with snapshots of the L-EF loop extracted from the GaMD simulations (green). When present in the crystal structure and the simulation, sulfate anions are represented by spheres. I-L, Alterations in anion and substrate-binding clefts arise from the activation loop switch and tau mutation. Volumes for the binding clefts were extracted and averaged from GaMD simulations in the four states: panel I, WT CK1δloop down; J, WT CK1δloop up; K, tau CK1δloop down; L, tau CK1δloop up. Water and anions were removed from the analysis. Volumetric maps are contoured at 0.1 and represent regions that were consistently open during the simulations. See also Figure 4—figure supplement 1 and Supplementary file 1d for more information.


