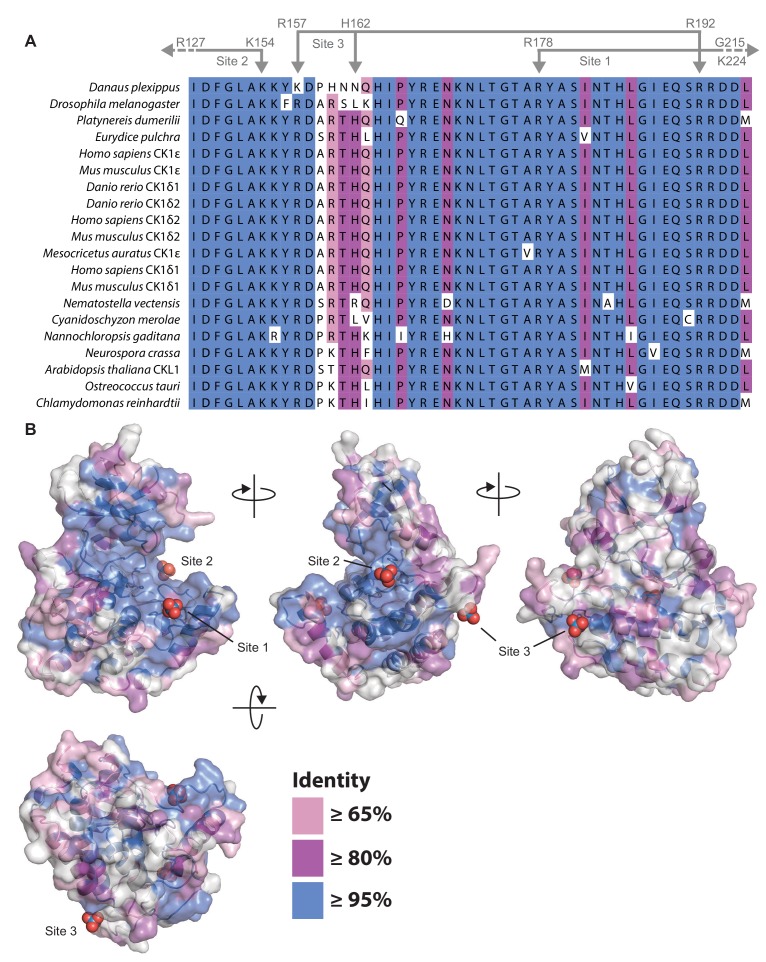
(
A) Alignment of the central catalytic DFG motif and activation loop of CK1ε and CK1δ (including isoforms δ1 and δ2 that differ only in the last 15 amino acids
Fustin et al., 2018;
Narasimamurthy et al., 2018) that have been implicated in circadian regulation of the following species:
Danaus plexippus (
Reppert et al., 2016);
Drosophila melanogaster (
Kloss et al., 1998;
Price et al., 1998);
Platynereis dumerilii (
Zantke et al., 2013);
Eurydice pulchra (
Zhang et al., 2013);
Homo sapiens (
Beale et al., 2019;
Toh et al., 2001;
Xu et al., 2005;
Xu et al., 2007);
Mus musculus (
Fustin et al., 2018;
Meng et al., 2008);
Danio rerio (
Smadja Storz et al., 2013),
Mesocricetus auratus (
Ralph and Menaker, 1988);
Nematostella vectensis (
Oren et al., 2015);
Cyanidoschyzon merolae (
Matsuzaki et al., 2004);
Nannochloropsis gaditana (
Poliner et al., 2019);
Neurospora crassa (
Görl et al., 2001);
Arabidopsis thaliana (
Uehara et al., 2019);
Ostreococcus tauri (
van Ooijen et al., 2013); and
Chlamydomonas reinhardtii (
Boesger et al., 2012;
Boesger et al., 2014). When only one CK1δ/ε-like homolog was identified in an organism, no gene name is shown in the alignment. Coloring indicates the degree of conservation, with ≥95% identity in blue, ≥80% identity in purple, ≥65% identity in pink, and <65% identity in white. Residues that coordinate anion binding on CK1 are indicated above in gray. (
B) Conservation from the kinase domain alignment mapped onto the WT CK1δ kinase domain (PDB: 1CKJ, chain B). The binding sites for three highly conserved anion are indicated.


