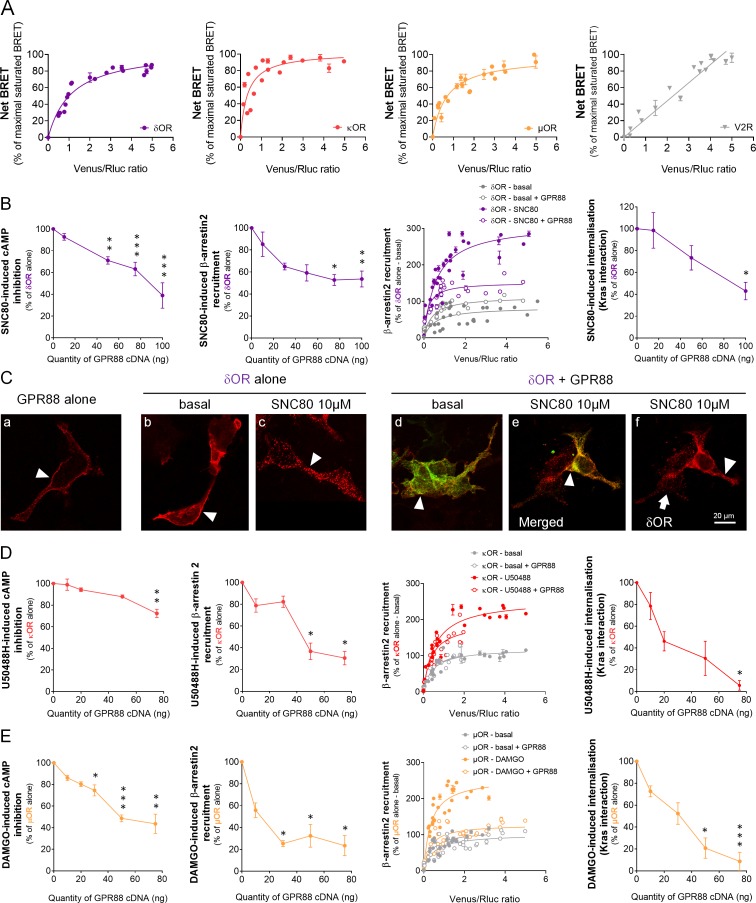
Figure 1. GPR88 comes in close physical proximity to opioid receptors and inhibits their signaling and trafficking in vitro.
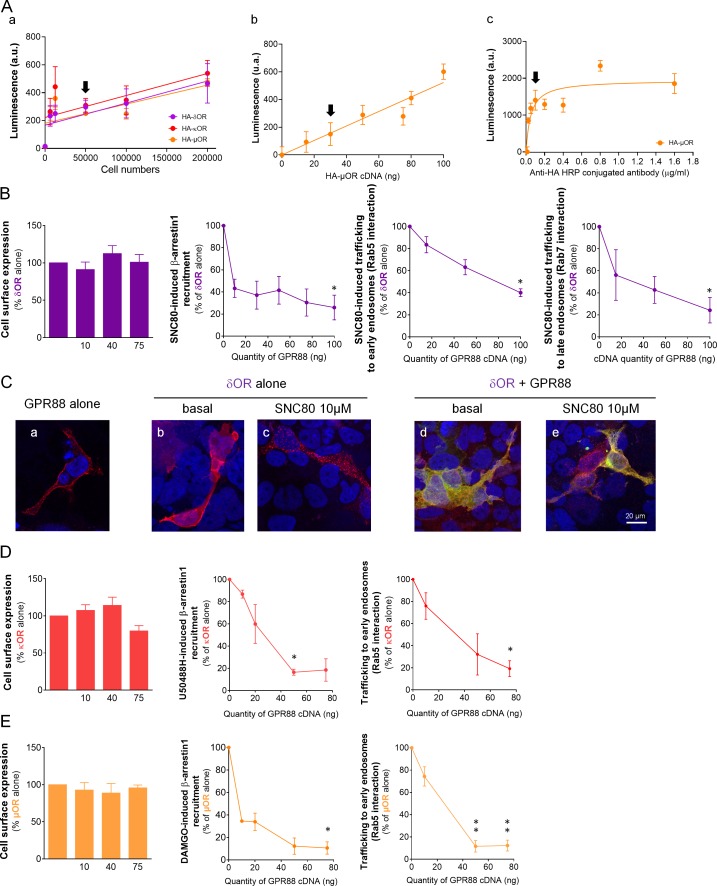
(A) BRET1 saturation experiments were performed in transfected HEK293FT cells using constant quantity of GPR88-Rluc8 with increasing amounts of Venus-tagged opioid receptors δOR, κOR and μOR or V2R. Saturated BRET signals indicate close physical proximity (within 10 nm) to the target GPCR, thus possible hetero- or homo-oligomers. Such saturation is not observed with the V2R (right panel), D1 or CXCR4 receptors (see Figure 4), showing that close proximity is not detected for all GPCRs. See reverse constructions for δOR, κOR in Figure 1—figure supplement 1 (B) Co-expressing GPR88 with δOR (wild-type or Rluc8-tagged, 30 ng of cDNA) blunts (left to right panels): SNC80 (δOR agonist, 10 μM)-induced inhibition of cAMP production (cAMP sensor: CAMYEL) (H4,39=28.7, p=0.0000) and Ypet-β-arrestin 2 (β-arr2) recruitment (H5,28=18.1, p=0.0028), Ypet-β-arr2 recruitment at δOR under stimulated but not basal conditions and, finally, SNC80-induced δOR internalization (internalization sensor: Kras-Venus) (H3,12=7,8, p=0.0492) in HEK293FT cells. (C) Confocal microscopy images show (arrow head) that (a) HA-GPR88 (red) is localized at cell surface (non-permeabilized cells), (b) under basal conditions, HA-δOR (red) is localized at cell surface, (c) SNC80-stimulation induces HA-δOR internalization, (d) under basal conditions, HA-δOR (red) and GPR88-Venus (green) co-localize at cell surface, (e) under SNC80 stimulation, GPR88 inhibits δOR internalization, (f) which results in different patterns of HA-δOR (red) distribution in GPR88-Venus (green) expressing versus non-expressing cells (arrow head versus arrow, respectively). (D) Co-expressing GPR88 with κOR (wild-type or Rluc8-tagged, 30 ng of cDNA) decreases (left to right panels): U50488H (κOR agonist, 10 μM)-induced inhibition of cAMP production (CAMYEL) (H4,25=17.9, p=0.0013) and Ypet-β-arr2 recruitment (H4,19=15.9, p=0.0031), Ypet-β-arr2 recruitment at κOR under stimulated but not basal conditions and U50488H-induced κOR internalization (Kras-Venus) (H4,18=13.6, p=0.0087) in HEK293FT cells. (E) Co-expressing GPR88 with µOR (wild-type or Rluc8-tagged, 30 ng of cDNA) inhibits (left to right panels): DAMGO (µOR agonist, 10 μM)-induced inhibition of cAMP production (CAMYEL) (H5,34=27.7, p=0.000) and Ypet-β-arr2 recruitment (H4,23=18.2, p=0.0011), Ypet-β-arr2 recruitment at µOR under stimulated but not basal conditions and DAMGO-induced µOR internalization (Kras-Venus) (H4,23=19.7, p=0.0006) in HEK293FT cells. Inhibition of cAMP production was determined in presence of 250 μM IBMX and 5 μM forskolin. Data are presented as mean ± SEM of n = 3–9 independent experiments (performed in triplicates). BRET1 values are presented as net BRET (normalized as the percentage of maximal BRET values) or induced BRET (normalized as the percentage of maximal BRET values in absence of GPR88) by Venus/Rluc8 BRET ratio. Asterisks: Kruskal-Wallis ANOVA, multiple comparison of mean ranks, *p<0.05, **p<0.01, ***p<0.001. Confocal imaging: representative pictures among n = 10 pictures. Receptor cell surface expression and additional data regarding OR trafficking in presence of GPR88 are displayed in Figure 1—figure supplement 2.


