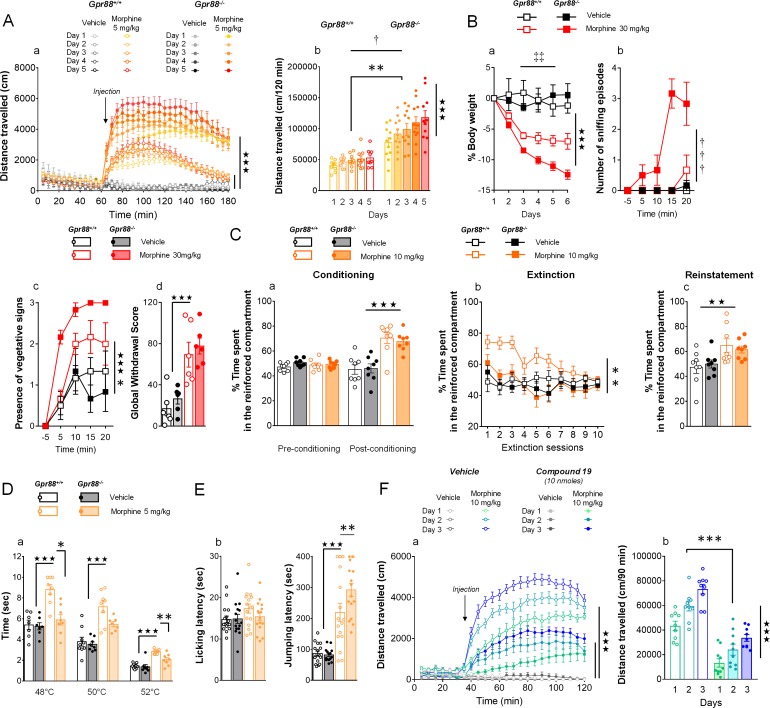
Figure 3. Gpr88 null mice display modified mu-opioid mediated behavioral responses.
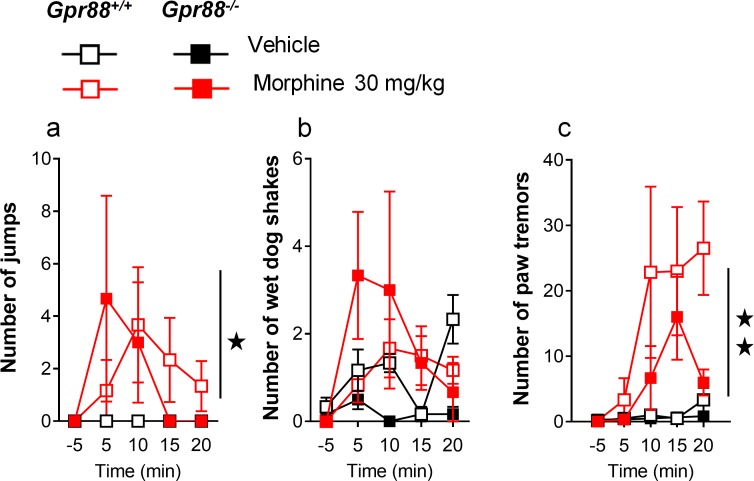
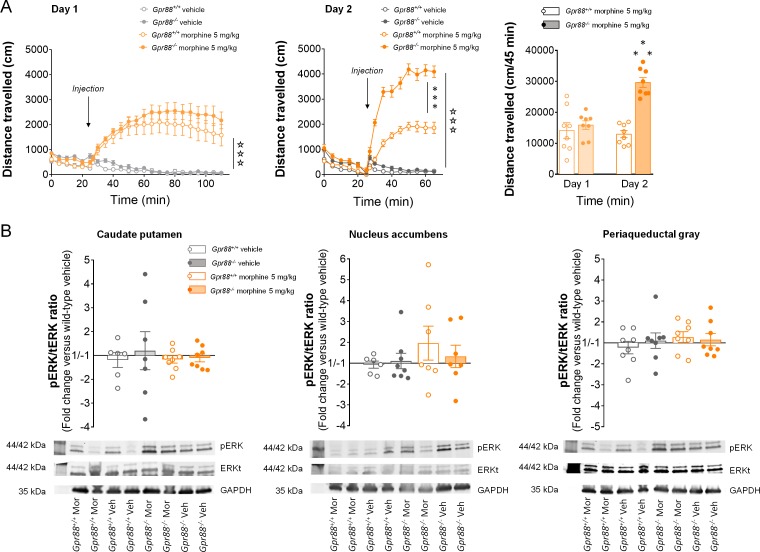
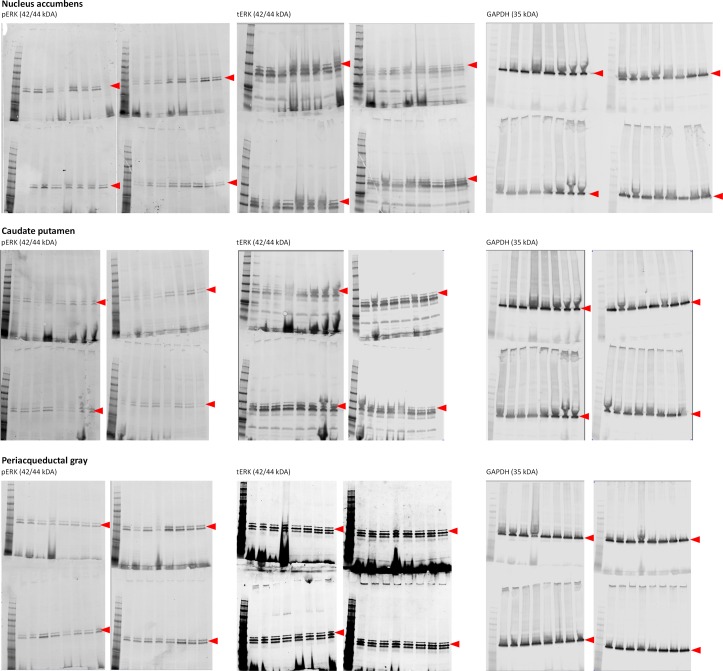
(A) In a locomotor sensitization paradigm (n = 5 to 11 mice per treatment and genotype) morphine induced an increase in locomotor activity that sensitized upon repeated administration in Gpr88+/+ and Gpr88-/- mice (panel a); morphine-induced locomotion and sensitization, however, were significantly greater in mutant mice (panel b) (Genotype effect: F1,27=13.5, p=0.0010; Treatment: F1,27=99.9, p=0.0000; Genotype x Treatment interaction: F1,27=14.6, p=0.0007; Day: F4,108=7.9, p=0.0000; Day x Treatment: F4,108=10.2, p=0.0000; Day x Genotype x Treatment = 2.9, p=0.0253); solid stars: treatment effect (two-way ANOVA with one repeated measure – day), asterisks: genotype effect, dagger: Day x Genotype x Treatment interaction. (B) Upon exposure to escalating doses of morphine (n = 6 per treatment and genotype), Gpr88-/- lost more body weight than controls (panel a; Treatment: F1,20=43.7, p=0.0000; Day: F4,80=13.6, p=0.0000; Day x Genotype: F4,80=5.1, p=0.001; Day x Treatment: F4,80=9.9, p=0.0000; body weight was measured daily upon morphine treatment); when withdrawal was triggered by acute naloxone administration (1 mg/kg), mutant animals displayed sniffing episodes (panel b; Genotype/Treatment: F1,20=25.5, p=0.0000; Genotype x Treatment: F1,20=23.1, p=0.0001; Time: F3,60=10.5, p=0.0000; Time x Genotype/Treatment: F3,60=9.3, p=0.0000; Time x Genotype x Treatment: F3,60=8.3, p=0.0001) and vegetative signs of withdrawal (panel c; Genotype: F1,20=5.3, p=0.0324; Treatment: F1,20=5.3, p=0.0324; Time: F3,60=14.4, p=0.0000) quicker than their Gpr88+/+ counterparts, despite similar final withdrawal scores (panel d; Treatment: F1,20=38.9, p=0.0000); solid stars: treatment effect (two-way ANOVA with one repeated measure – day/5 min time bin), double daggers: Time x Genotype interaction, daggers: Time x Genotype x Treatment interaction, asterisk: genotype effect. More withdrawal signs are displayed in Figure 3—figure supplement 1. (C) In a CPP paradigm (n = 8 per treatment and genotype), Gpr88-/-mice acquired preference for a compartment associated to morphine administration (10 mg/Kg) similarly as Gpr88+/+ animals (panel a; Treatment: F1,28=45.8, p=0.0000; Conditioning: F1,28=15.7, p=0.0005; Conditioning x Treatment: F1,28=31.1, p=0.0000); they extinguished this conditioning quicker than wild-type counterparts (panel b; Genotype: F1,28=10.3, p=0034; Treatment: F1,28=6.5, p=0166; Genotype x Treatment: F1,28=5.0, p=0329; Session: F9,252=5.2, p=0.0000; Session x Treatment: F9,252=3.7, p=0.0002) and finally reinstated morphine place preference at comparable levels as the latter (panel c; Treatment: F1,28=9.2, p=0.0052); solid stars: Treatment effect (two-way ANOVA with one repeated measure – day/5 min time bins); asterisks: Genotype effect. (D) In the tail flick test (n = 7–9 per treatment and genotype), Gpr88-/- mice were significantly less sensitive to morphine analgesia at 48°C and 52°C (Genotype: F1,83=22.0, p=0.0000; Treatment: F1,83=84.9, p=0.0000; Temperature: F2,83=162.5, p=0.0000; Genotype x Treatment: F1,83=15.9, p=0.0001; Treatment x Temperature: F2,83=5.4, p=0.0065); (E) in the hot plate test (n = 15–16 per treatment and genotype), morphine-induced analgesia was detected by increased jumping latency in treated animals (right panel); this effect was increased in Gpr88 null mice versus controls (Treatment: F1,59=79.7, p=0.0000; Genotype x Treatment: F1,59=4.0, p=0.0490); solid stars: Treatment effect (two-way ANOVA), asterisks: Genotype x Treatment interaction (Newman Keules post-hoc test). Increased morphine-induced locomotor sensitization in Gpr88 null mice was not associated with modified pERK/tERK ratio in three brain regions (Figure 3—figure supplements 2 and 3). (F) We administered the GPR88 agonist Compound 19 (icv, 10 nmoles) to mice exposed to a morphine-induced locomotor sensitization paradigm (n = 8 to 9 mice per treatment condition). Exposure to morphine (IP, 10 mg/kg) induced an increase in locomotor activity that sensitized upon repeated administration in both vehicle and Compound 19-treated groups (panel a); pharmacological activation of GPR88 drastically reduced morphine-induced locomotor activity but left the amplitude of sensitization unchanged (Morphine effect: F1,30=305.1, p=0.0000; Compound 19: F1,30=55.3, p=0.0000; Day: F2,60=33.1, p=0.0000; Day x Morphine: F2,60=31.6, p=0.0000; Day x Morphine x Compound 19: F2,60=2.1, NS), solid stars: treatment effect (two-way ANOVA with one repeated measure – day), asterisks: genotype effect. Data are presented as mean ± SEM. One symbol: p<0.05, two symbols: p<0.01, three symbols: p<0.001.


