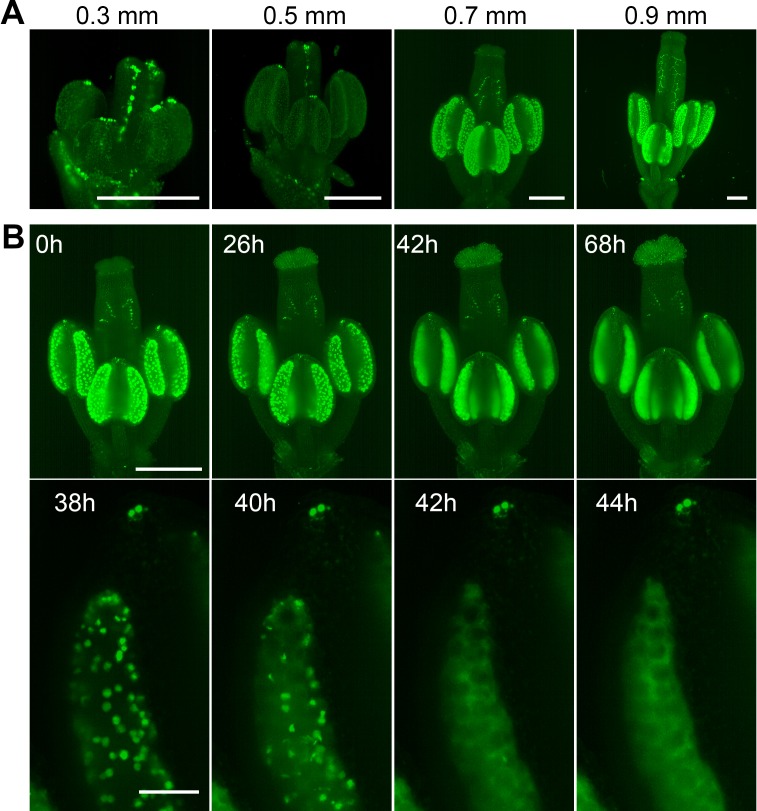
Figure 4. Spatiotemporal distribution of auxin response in flower.
(A) MIPs of DR5::N7-Venus signal of four different flower buds of different sizes. Scale bar 200 µm. (B) Time lapse imaging of a flower at developmental stage 12 expressing DR5::N7-Venus in 2 hr intervals (upper panel). Scale bar 300 µm. Lower panel: detail of a loculus showing release of the nuclear content into the cytoplasm between 40 and 42 hr. Scale bar 50 µm. Non-linear transformation by gamma was used to enhance the outline of the flower.

