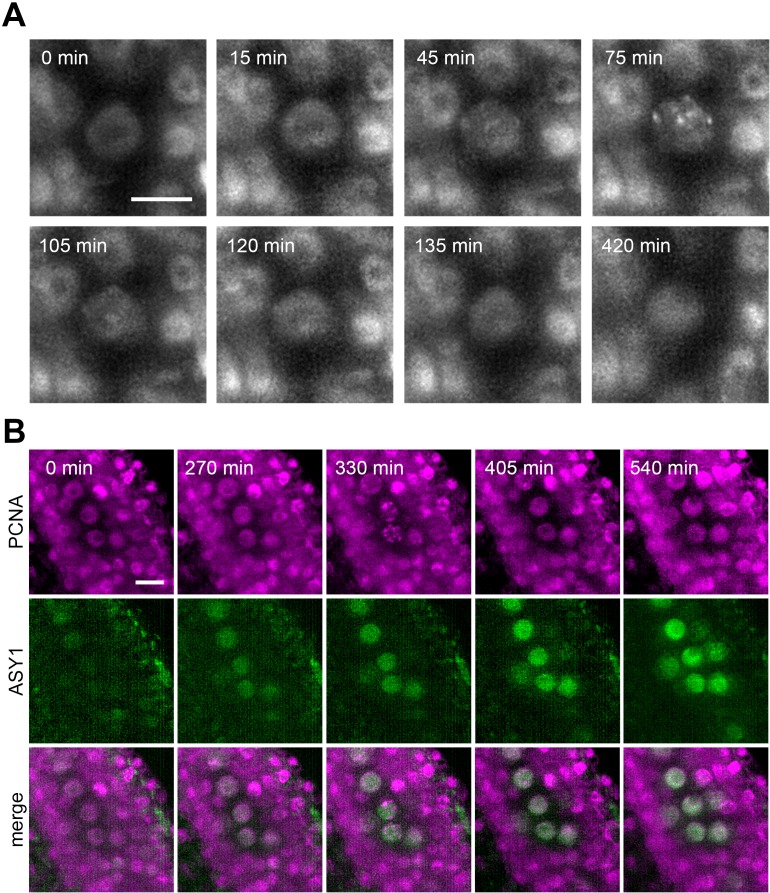
Figure 6. Protein localization in meiotic S-phase.
(A) Time lapse imaging of PCNA:TagRFP during meiotic S-phase. Nuclear speckles are visible between 45 to 120 min. Images were taken every 15 min, scale bar 10 µm. (B) Time lapse imaging of PCNA:TagRFP (magenta) and ASY1:eYFP (green) in PMCs. Timeframe ranges from the first appearance of ASY1 signal prior to S-phase (0 min) to late leptotene/zygotene (540 min). Images were taken every 15 min, scale bar 10 µm.

