. 2020 Feb 11;9:e51271. doi: 10.7554/eLife.51271

Figure 2. MHb neuron subtypes can be distinguished transcriptionally.

(A) Location of MHb and ISH of Tac2 expression from the Allen Institute Database. Tac2 expression is restricted to cells in the MHb in this region. (B) Tac2 serves as an excellent marker for MHb neurons in the dataset of SCTs (Scale on right shows normalized (log) gene expression.) (C) Left: Illustration showing patterns of gene expression observed for DEGs using the Allen Institute Database. Right: Sample ISH images from the Allen Institute Database showing selected differentially expressed genes for distinct transcriptionally defined neuronal subtypes in MHb. (D) Left: Dendrogram with MHb subtype labels corresponding to clusters shown in (Figure 2—figure supplement 1C). Right: Heatmap showing the relative expression (mean z- scored) of selected genes that are enriched in each MHb neuron subtype. Spatial distributions of enriched genes highlighted in (C) are labeled in red.

Figure 2.

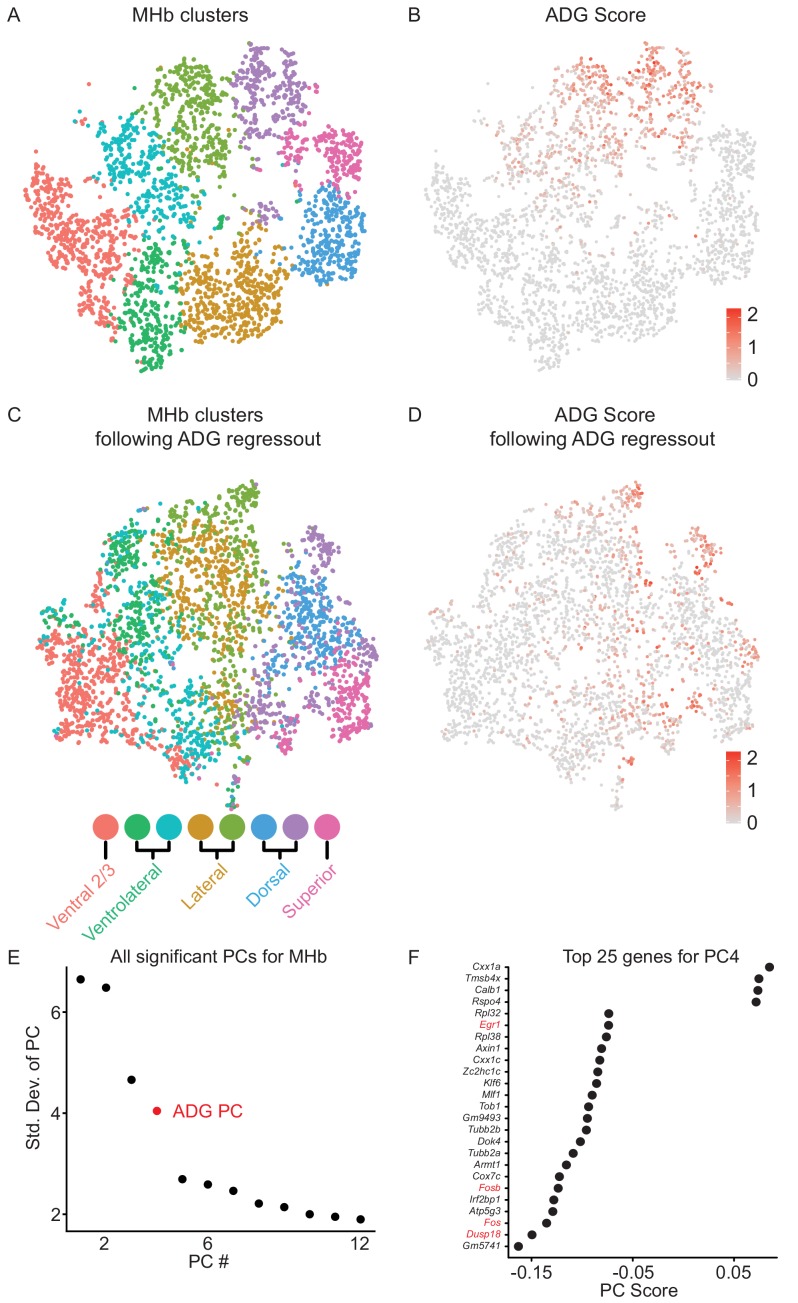
Figure 2—figure supplement 1. Subclustering of MHb neurons before and after subtraction of heterogeneity introduced by elevated expression of activity-dependent genes (ADGs).

Figure 2—figure supplement 1.

(A) t-SNE plot of subclustered MHb neurons extracted from cells in Figure 1B. (B) t-SNE plot showing three clusters of cells (top) that expressed elevated levels of several ADGs (Fos, Fosb, Egr1, Junb, Dusp18, etc.). (C) t-SNE plot after regressing out the principle component (PC) that included many of the ADGs shown in (B). Cells from clusters that were high in ADG expression were now intermingled with clusters that we defined by the spatial location of their DEGs (See also Figure 2C and D). (D) t-SNE plot showing ADG score following regressing out of the PC containing ADGs. (E) All 12 statistically significant PCs for the MHb neuron clusters shown above. PC number 4 (red) contained several ADGs. (F) The top 25 genes associated with PC4 (the ADG PC) contained several known ADGs highlighted in red.
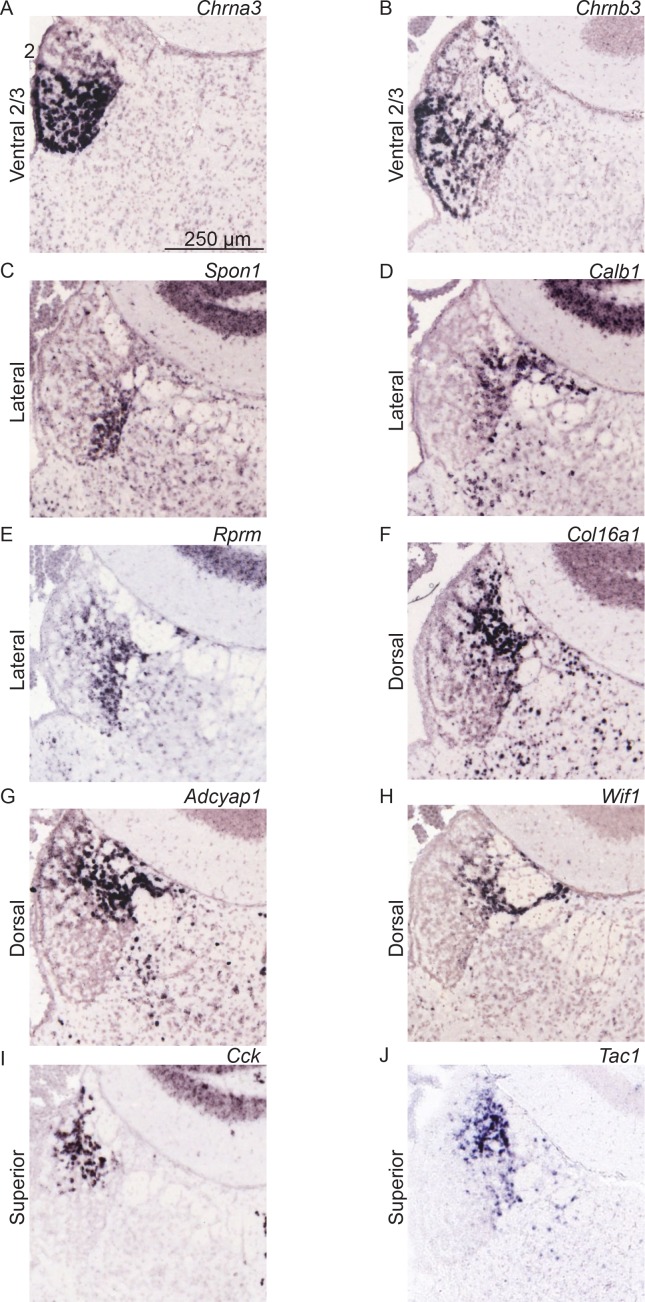
Figure 2—figure supplement 2. Sample ISH images showing spatial distribution of selected differentially expressed genes in MHb.

Figure 2—figure supplement 2.

(A–J) Sample ISH images from the Allen Institute Database showing selected differentially expressed genes for distinct transcriptionally defined neuronal subtypes in MHb. Gene name is in the upper right of each image and subregion where gene is enriched is on the left. Scale bar = 250 μm.
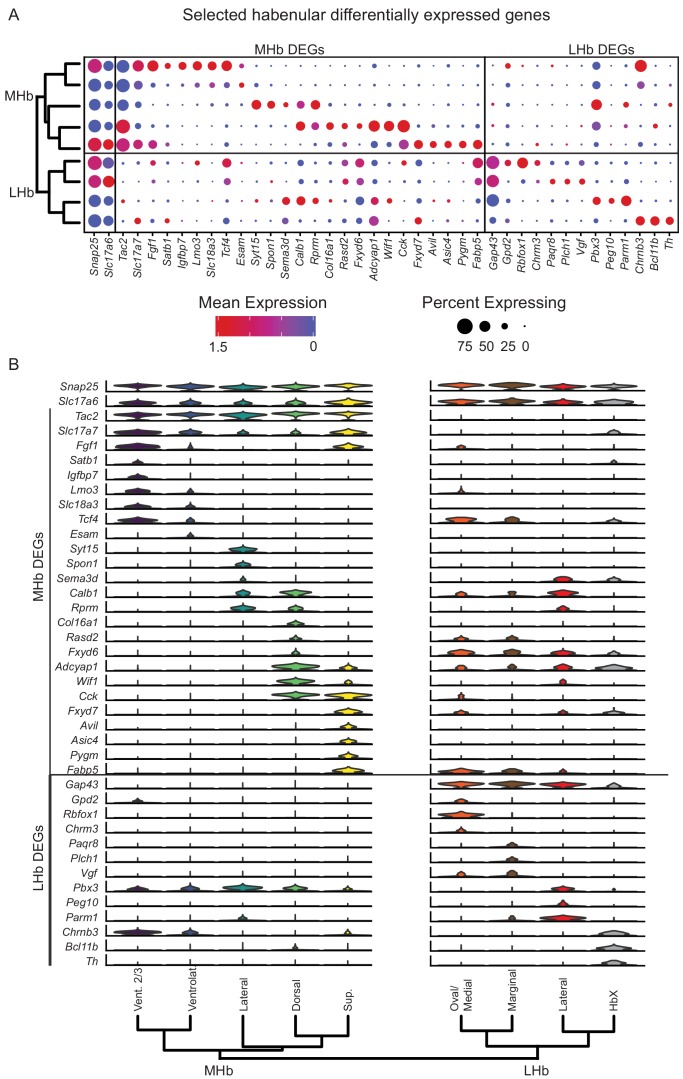
Figure 2—figure supplement 3. Differentially expressed genes define distinct habenular subtypes.

Figure 2—figure supplement 3.

(A) Left: Dendrogram for subclustering of all neurons shown in Figures 2 and 3. Right: Dot plot displaying expression of example differentially expressed genes used to identify each subtype of habenula neuron. The color of each dot (blue to red) indicates the relative expression of each gene, whereas the dot size indicates the fraction of cells expressing the gene. (B) Violin plots of expression level for select MHb and LHb DEGs. The Y-axis maximum for all plots is 5 (log2 transformed and scaled) and minimum is 1. Colored region of the plot shows the probability distribution of all neurons in the labeled cluster. Only representative genes are shown – for entire list of DEGs see Supplementary file 3 and 5.
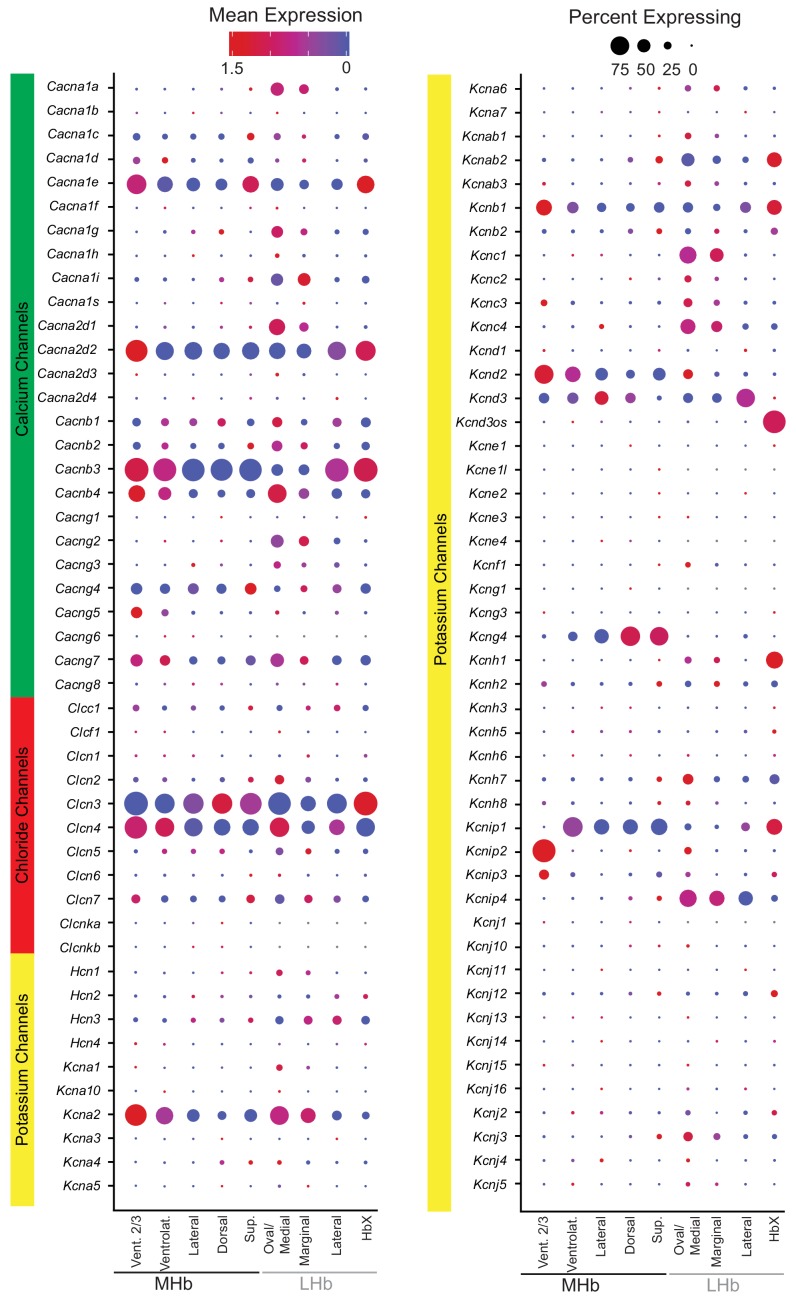
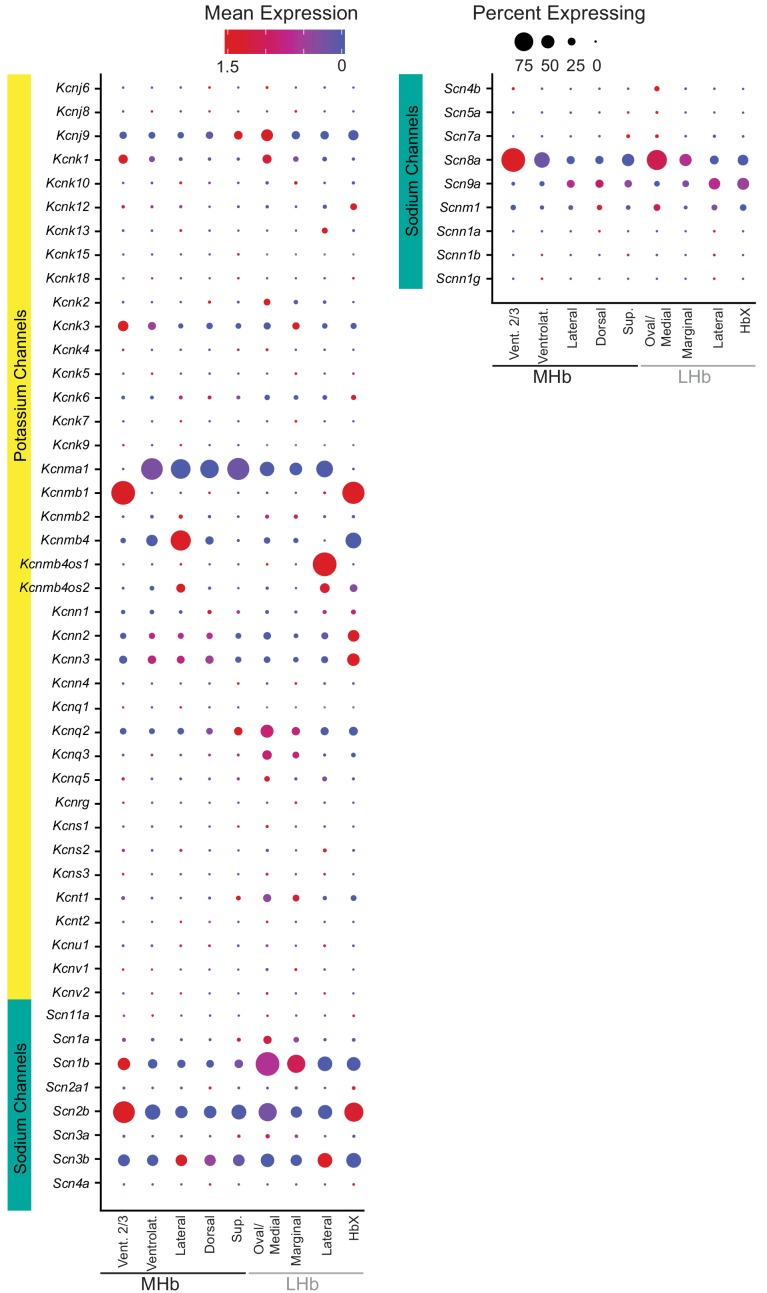
Figure 2—figure supplement 4. Ion channel diversity in MHb and LHb neuronal subtypes.

Figure 2—figure supplement 4.

Dot plot displaying the expression of all ion channels detected in MHb and LHb neurons. The color of each dot (blue to red) indicates the relative expression of each gene, whereas the dot size indicates the fraction of cells expressing the gene.
Figure 2—figure supplement 5. Ion channel diversity in MHb and LHb neuronal subtypes (part 2).

Figure 2—figure supplement 5.

Dot plot displaying the expression of all ion channels detected in MHb and LHb neurons. The color of each dot (blue to red) indicates the relative expression of each gene, whereas the dot size indicates the fraction of cells expressing the gene.
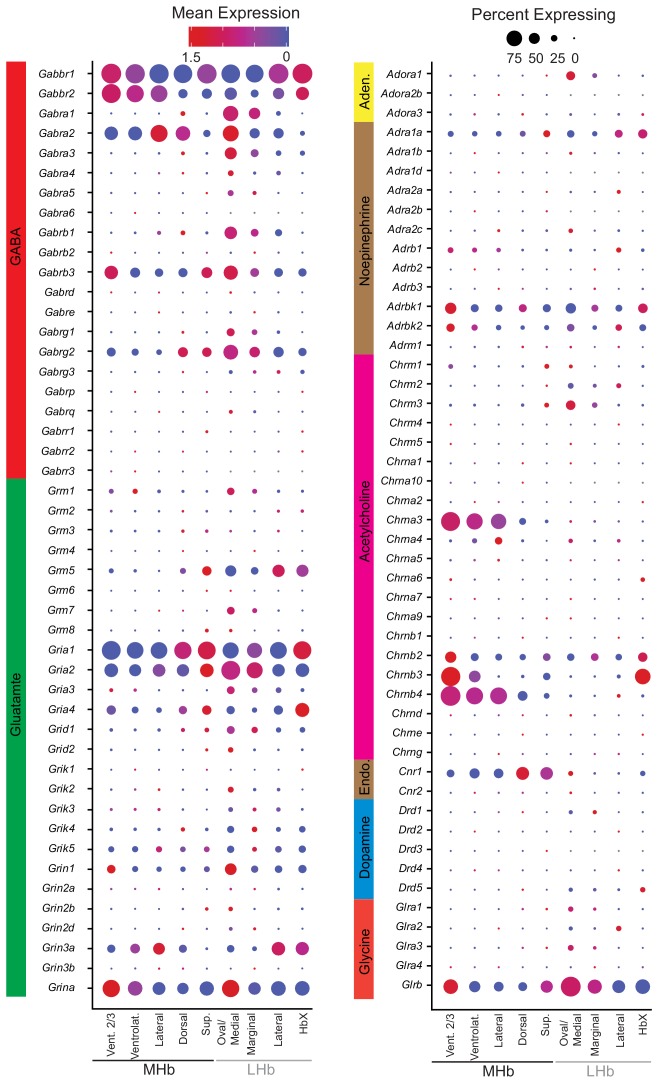
Figure 2—figure supplement 6. Neurotransmitter receptor diversity in MHb and LHb neuronal subtypes.

Figure 2—figure supplement 6.

Dot plot displaying gene expression of all small molecule neurotransmitter receptors detected in MHb and LHb neurons. The color of each dot (blue to red) indicates the relative expression of each gene, whereas the dot size indicates the fraction of cells expressing the gene.
Figure 2—figure supplement 7. Neurotransmitter receptor diversity in MHb and LHb neuronal subtypes (part 2).
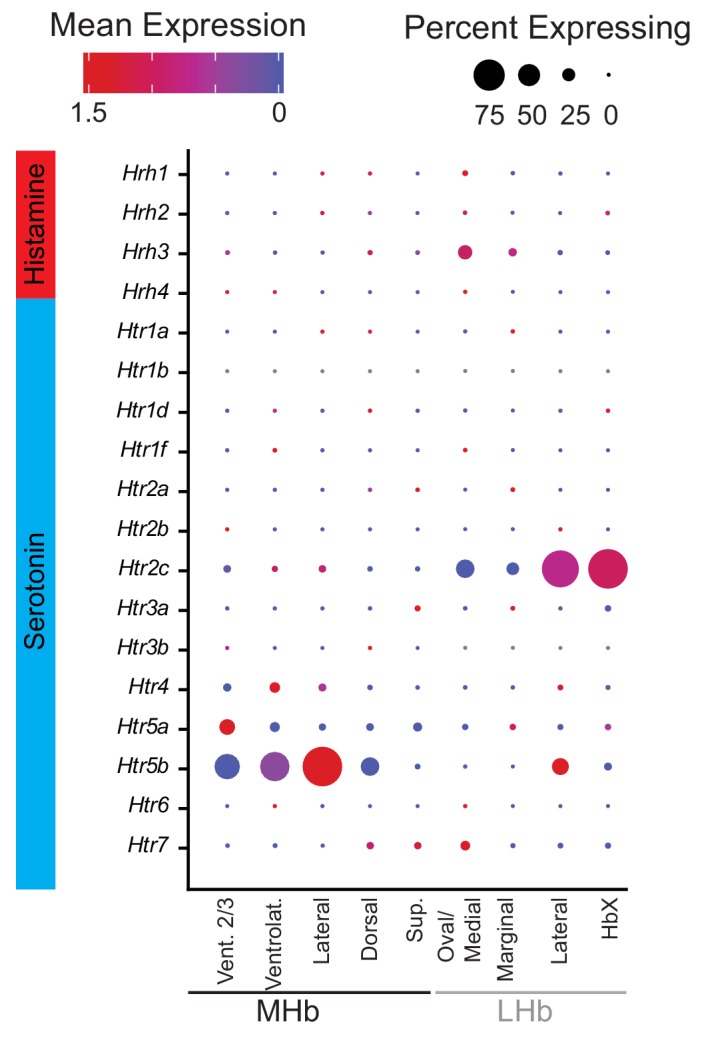
Figure 2—figure supplement 7.

Dot plot displaying gene expression of all small molecule neurotransmitter receptors detected in MHb and LHb neurons. The color of each dot (blue to red) indicates the relative expression of each gene, whereas the dot size indicates the fraction of cells expressing the gene.
Figure 2—figure supplement 8. GPCR diversity in MHb and LHb neuronal subtypes.

Figure 2—figure supplement 8.

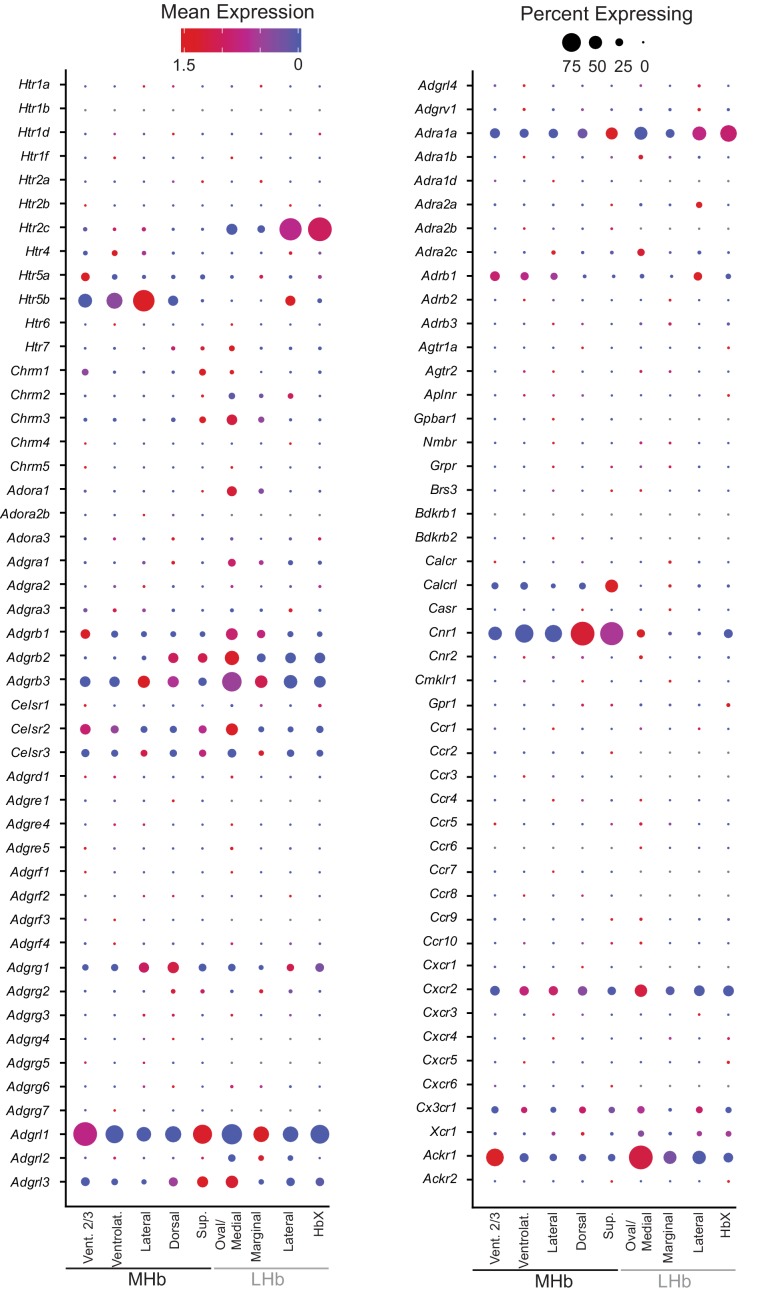
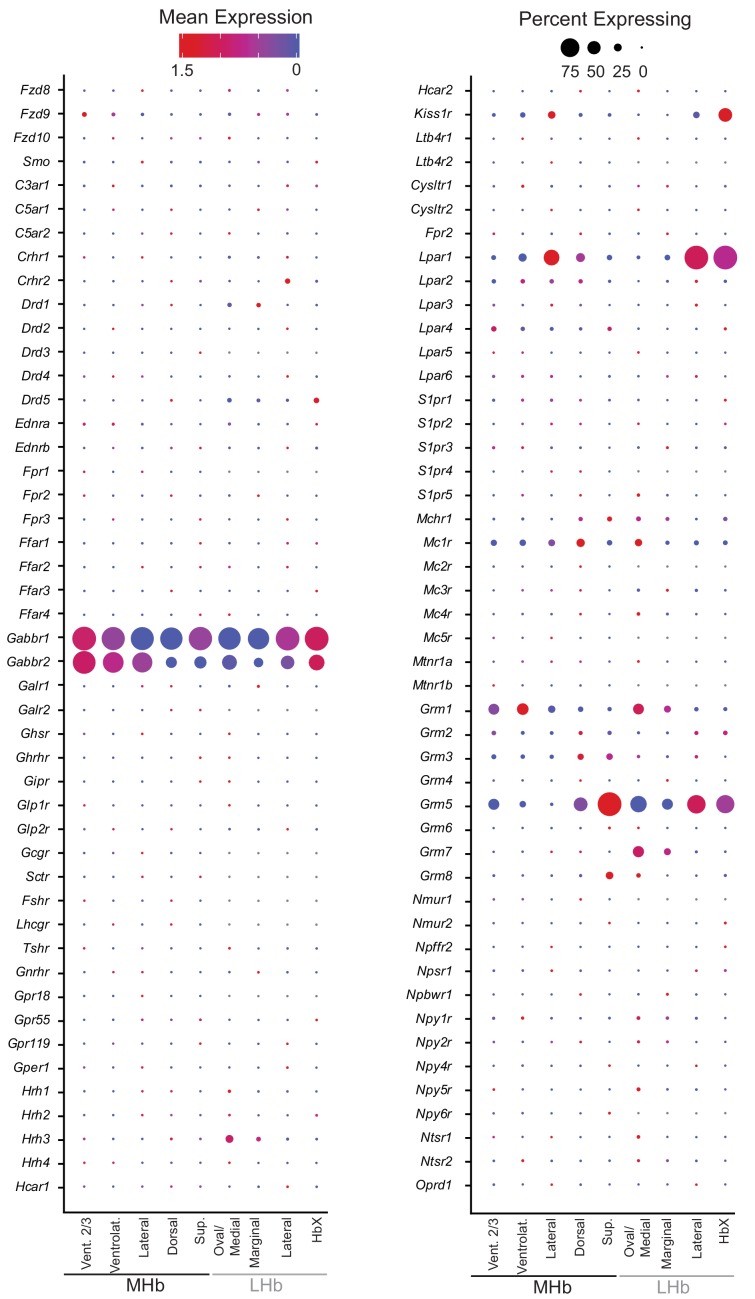
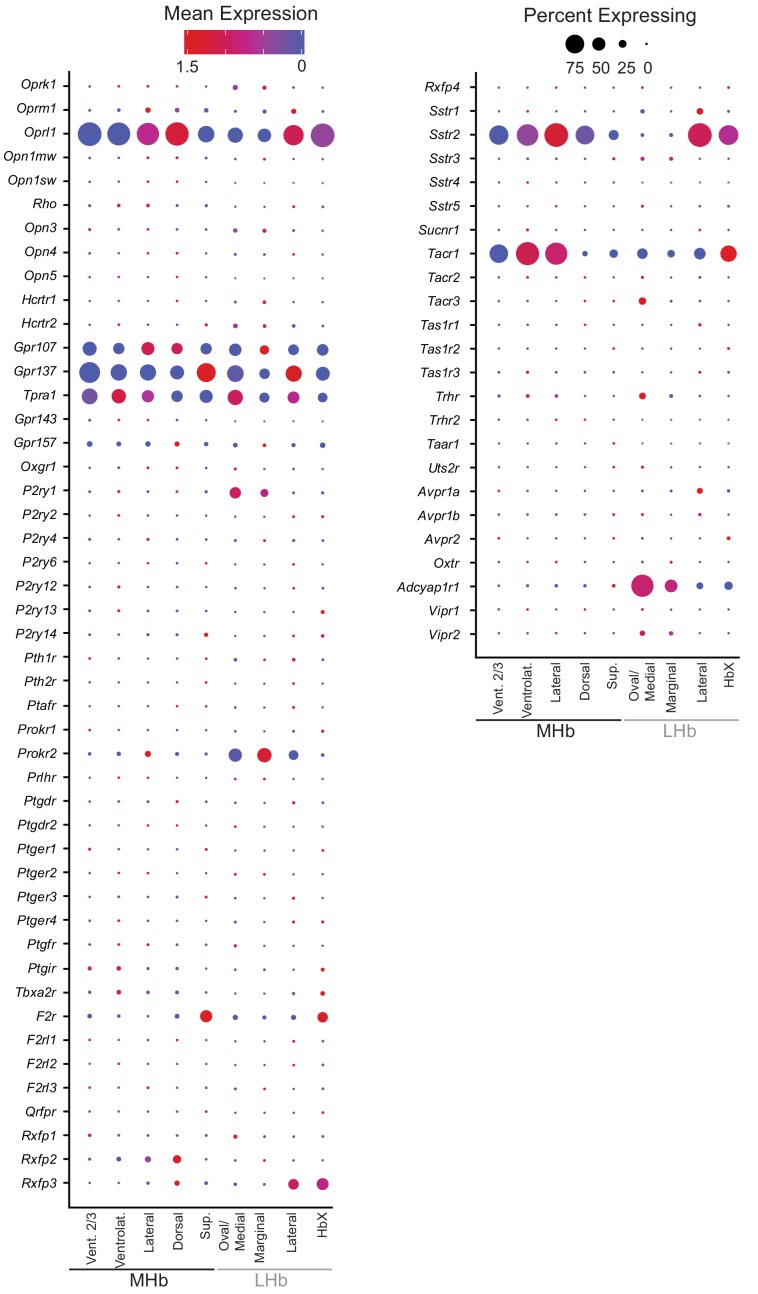
Dot plot displaying gene expression of all GPCRs detected in MHb and LHb neurons (Harding et al., 2018; Regard et al., 2008). Genes are grouped and listed alphabetically by receptor family name (Adenosine Receptors, Somatostatin Receptors, etc.). The color of each dot (blue to red) indicates the relative expression of each gene whereas the dot size indicates the fraction of cells expressing the gene.
Figure 2—figure supplement 9. GPCR diversity in MHb and LHb neuronal subtypes (part 2).
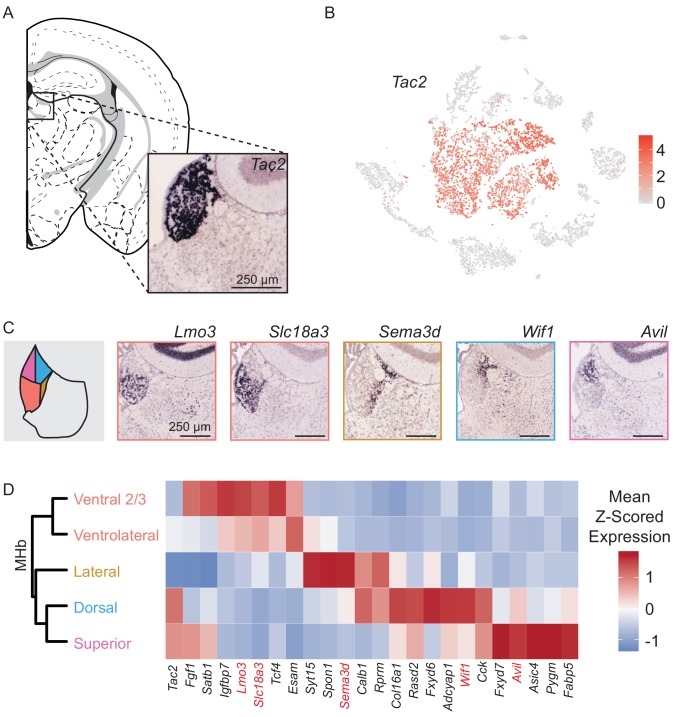
Figure 2—figure supplement 9.

Dot plot displaying gene expression of all GPCRs detected in MHb and LHb neurons (Harding et al., 2018Regard et al., 2008). Genes are grouped and listed alphabetically by receptor family name (Adenosine Receptors, Somatostatin Receptors, etc.). The color of each dot (blue to red) indicates the relative expression of each gene whereas the dot size indicates the fraction of cells expressing the gene.
Figure 2—figure supplement 10. GPCR diversity in MHb and LHb neuronal subtypes (part 3).

Figure 2—figure supplement 10.

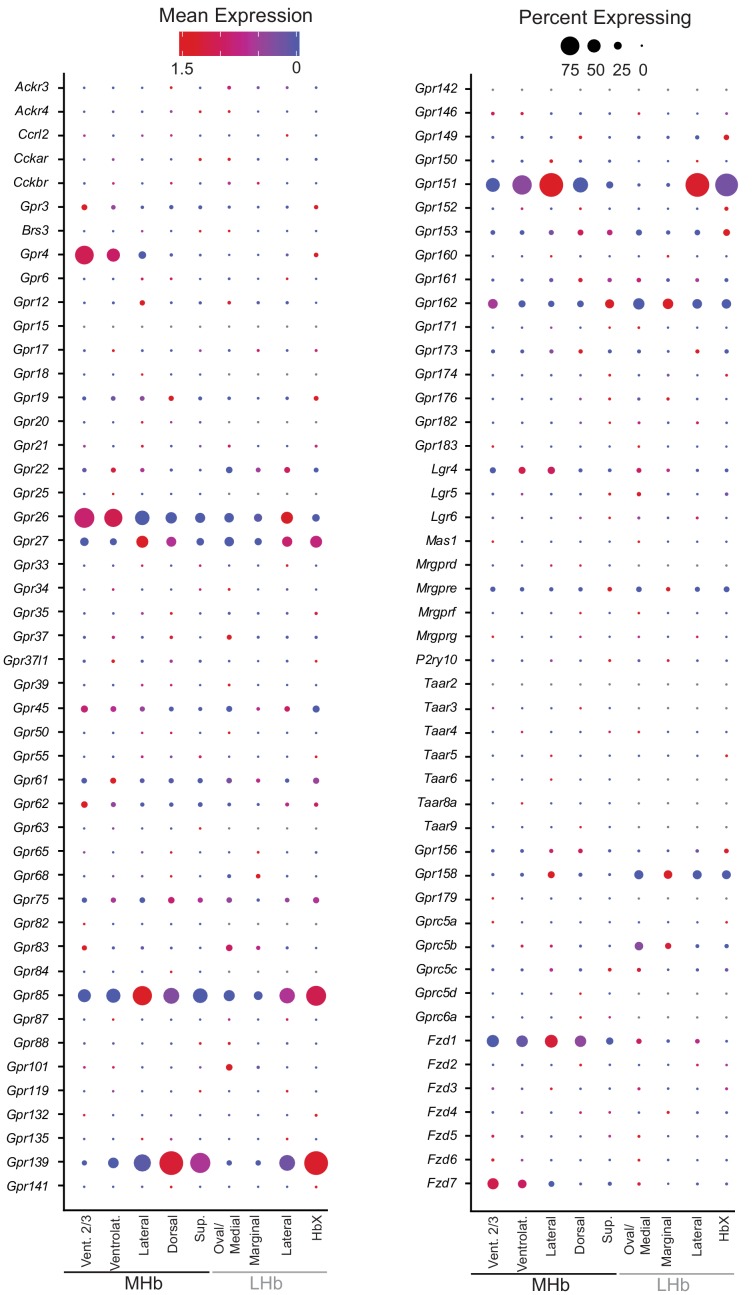
Dot plot displaying gene expression of all GPCRs detected in MHb and LHb neurons (Harding et al., 2018Regard et al., 2008). Genes are grouped and listed alphabetically by receptor family name (Adenosine Receptors, Somatostatin Receptors, etc.). The color of each dot (blue to red) indicates the relative expression of each gene whereas the dot size indicates the fraction of cells expressing the gene.
Figure 2—figure supplement 11. GPCR diversity in MHb and LHb neuronal subtypes (part 4).

Figure 2—figure supplement 11.

Dot plot displaying gene expression of all GPCRs detected in MHb and LHb neurons (Harding et al., 2018Regard et al., 2008). Genes are grouped and listed alphabetically by receptor family name (Adenosine Receptors, Somatostatin Receptors, etc.). The color of each dot (blue to red) indicates the relative expression of each gene whereas the dot size indicates the fraction of cells expressing the gene.