. 2020 Jan 17;9:e49967. doi: 10.7554/eLife.49967

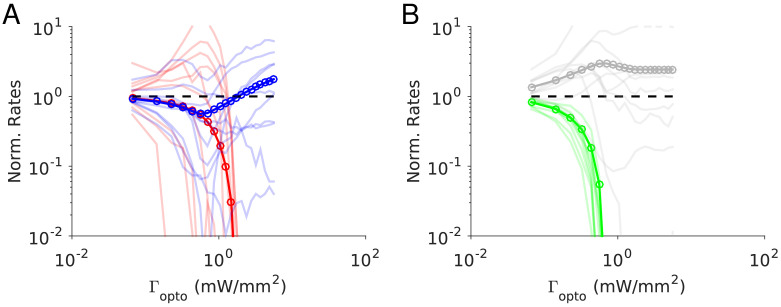
Figure 10. Numerical simulations of Model 2.

Responses of the neurons normalized to baseline vs. the intensity of the laser, Γopto . (A) Activities of PCs and PV neurons: for small Γopto , the PV response is paradoxical and the suppression of the PC and PV population activities relative to baseline are the same. (B) Activities of SOM and X neurons. Color code as in Figure 9. Thick lines: population averaged responses. Thin lines: responses of 10 neurons randomly chosen in each population. Firing rates were estimated over 100s. Parameters: K = 500, N = 76800. Other parameters as in Tables 67. The baseline activities are: rE  = 4.2 Hz, rI  = 6.8 Hz rS  = 7.0 Hz, rX  = 3.9 Hz.

Figure 10.

Figure 10—figure supplement 1. Model 2.

Figure 10—figure supplement 1.

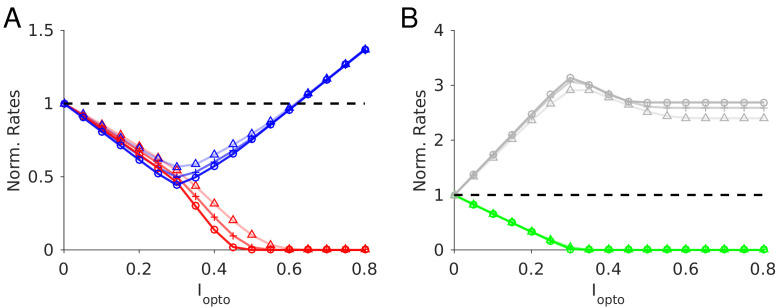
Robustness with respect to change in the average connectivity, K. Triangles: K = 500; cross: K = 1000; circles: K = 2000. N α = 10000 neurons per population. Color code and parameters as in Figure 10. Baseline firing rates: K = 500: rE  = 4.2 Hz rI  = 7.0 Hz, rS  = 7.0 Hz, rX  = 4.0 Hz, K = 1000: rE  = 4.0 Hz, rI  = 6.8 Hz, rS  = 6.8 Hz, rX  = 3.8 Hz; K = 2000: rE  = 3.7 Hz, rI  = 6.8 Hz, rS  = 6.7 Hz, rX  = 3.8. Rates are averaged over 10s.
Figure 10—figure supplement 2. Model 2.

Figure 10—figure supplement 2.

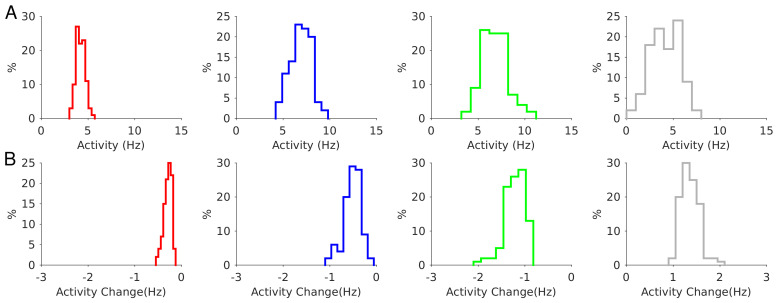
Robustness to a change of ±10% in the interaction parameters. (A) Distribution of the population activities. (B) Distribution of the activity changes upon stimulation for Γopto=0.07mW.mm-2 . Rates are averaged over 10s. Color code as in Figure 10.
Figure 10—figure supplement 3. Model 2.

Figure 10—figure supplement 3.

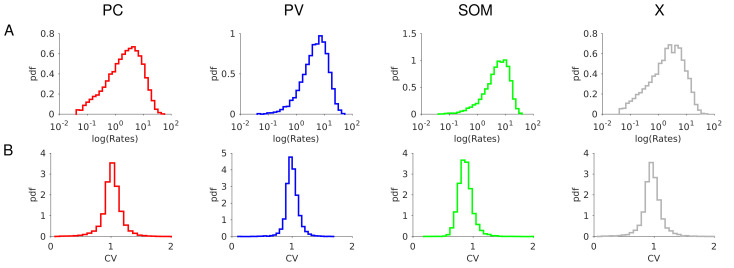
Firing statistics at baseline. (A) Distribution of the firing rates (mean: rE  = 4.5 HZ, rI  = 10.6 Hz, rS  = 7.2 hz, rV  = 4.9 Hz). (B) Distribution of CV. Individual rates are average over 100s with a threshold at 0.05Hz. CVs are computed over 30s. Color code and parameters as in Figure 10.