. 2020 Jan 17;9:e49967. doi: 10.7554/eLife.49967

Figure 3. Paradoxical effects in the two-population model.

(A) The network. (B–C) Responses of PCs and PV neurons normalized to baseline vs. the laser intensity, Γopto , for different values of the recurrent excitation, jEE . (B) jEE=JEE/K , the network exhibits the paradoxical effect. (C) jEE = 0, the population activity of PV neurons is almost insensitive to small laser intensities. Red: PCs. Blue: PV neurons. Thick lines: population averaged responses. Thin lines: responses of 10 neurons randomly chosen in each population. Firing rates were estimated over 100s. Parameters: NE = 57600, N1 = 19200, K = 500 N1  = 19200. Other parameters as in Tables 12. Baseline firing rates are: rE=5.7Hz , rI=11.7Hz (B) and rE=1.5Hz , rI=5.7Hz (C). At the minimum of rI in (B), rE=0.06Hz .

Figure 3.

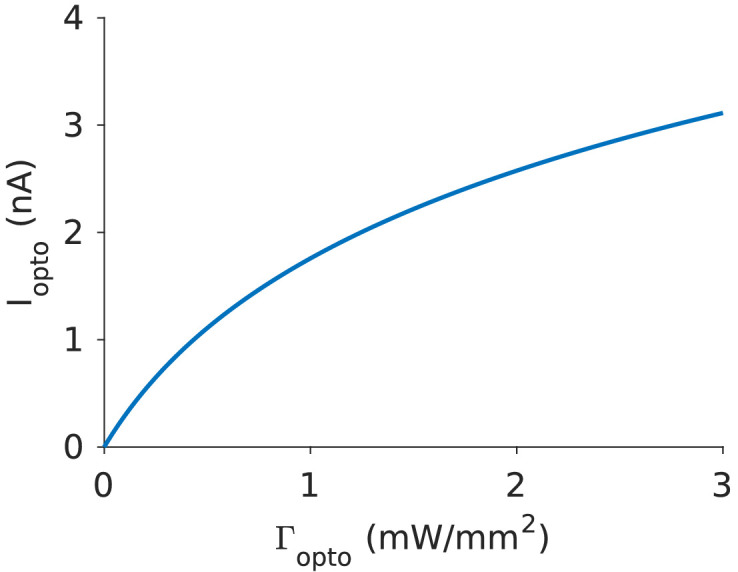
Figure 3—figure supplement 1. Current, Iopto , v.s. laser intensity, Γopto .

Figure 3—figure supplement 1.

Parameters are I0=8nA , Γ0=0.5mW.mm2 .
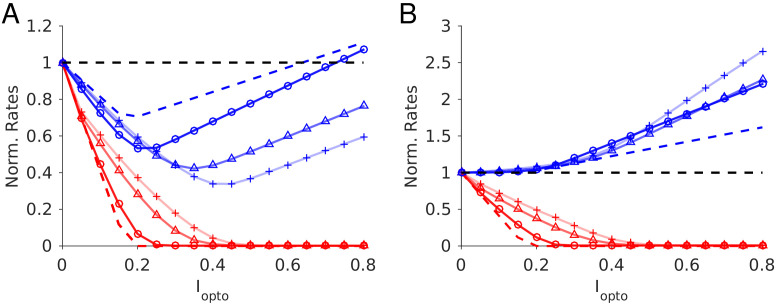
Figure 3—figure supplement 2. Effects of K on the responses of a two-population network to photoactivation of the inhibitory population.

Figure 3—figure supplement 2.

(A) JEE  = 22 μA.ms.cm-2, the inhibitory population activity always recovers when the PCs are silenced. (B) JEE  = 0, as K increases, the response of the inhibitory population becomes more and more insensitive to the perturbation. Cross: K = 50; triangles: K = 100; circles: K = 500. Dashed line: . Color code and parameters as in Figure 3. Baseline firing rates: A. K = 50: rE  = 10.8Hz, rI  = 16.8 Hz; K = 100: rE = 8.8 Hz, rI  = 14.7 Hz; K = 500: rE  = 5.7 Hz, rI  = 11.7 Hz; K= : rE  = 3.9 Hz, rI  = 8.5 Hz. B. K = 500: rE  = 1.9 Hz, rI  = 3.6 Hz; K = 100: rE  = 2 Hz, rI  = 4.8 Hz; K = 500: rE  = 1.5 Hz, rI  = 5.7 Hz; K= : rE  = 1.4 Hz, rI  = 9.1 Hz.
Figure 3—figure supplement 3. Two-population model.

Figure 3—figure supplement 3.

The response of the PC and PV populations upon stimulation of the latter are proportional only if parameters are fine-tuned. (A) χ-I/χ-E where χ¯α=rαlight on/rα-1/Γopto estimated for Γopto=0.5mW.mm-2 . The ratio is close to one only if JEEJEIJIE/JII=30μA.ms.cm-2 . (B) Red star indicates the approximate center of the region with proportionality of the responses together with reasonable activities. Parameters as in Figure 3. K = 500.