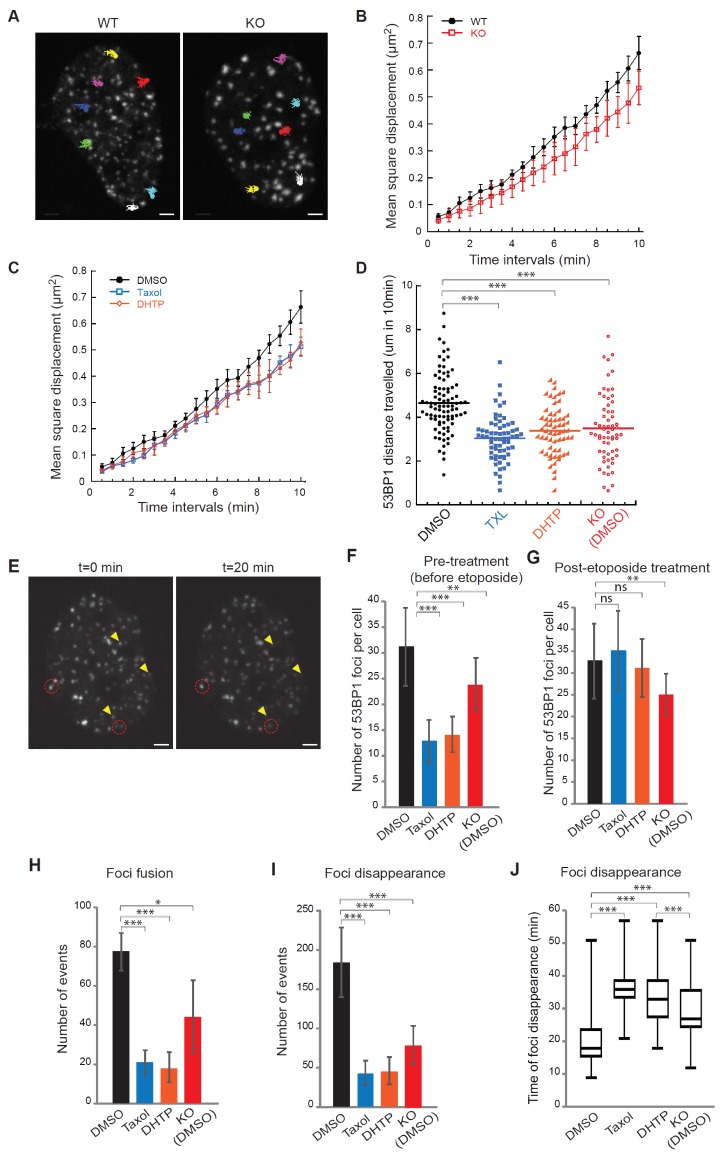
Figure 5. Kif2C mediates DNA double strand break mobility and foci dynamics.
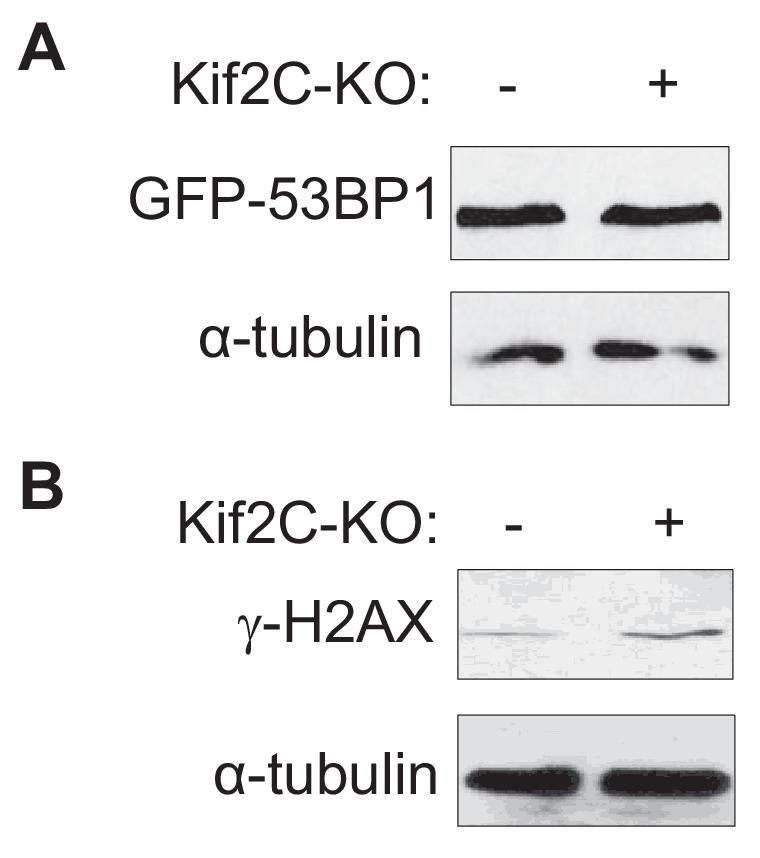
(A) Examples of 10 min mobility traces of EGFP-53BP1 foci in WT and Kif2c knockout (KO) U2OS cells after etoposide (20 μM) treatment. Kif2C depletion did not impact 53BP1 expression (Figure 5—figure supplement 1A). (B) Mean-square displacement measurements of EGFP-53BP1 foci in WT and Kif2C KO U2OS cells, shown in black in red, respectively. (C) Mean-square displacement measurements of EGFP-53BP1 foci in WT U2OS cells treated with the vehicle control (DMSO), Taxol (5 μM), or DHTP (20 μM), as indicated. (D) Quantification of the distance travelled by EGFP-53BP1 foci over 10 min in the corresponding cells described in B-C. (E) Examples of disappearance (yellow arrowheads) and fusion (red circle) events of EGFP-53BP1 foci induced by etoposide in U2OS cells. (F, G) Number of EGFP-53BP1 foci in WT or Kif2C KO U2OS cells, treated with the vehicle control (DMSO), Taxol, or DHTP. These inhibitors were added either 5 min before (F) or 5 min after (G) etoposide treatment. (H–J) Numbers of fusion (H) and disappearance (I–J) events of EGFP-53BP1 foci in the corresponding cells in panel G are shown. A total of 15 randomly selected cells were analyzed over three independent experimental runs. For disappearance events, number of occurrence in the first 30 min under each treatment condition is shown in (I) and the time required for foci disappearance (min) over the entire hour of recording is shown in (J) (>150 events quantified per condition). The box represents 50% of the foci disappearance events and the line shows the median of the data set. All microscopy image acquisitions began five minutes after final compound treatment, either every 30 s for 10 min (A–D) or every 3 min for one hour (H–J). All data were collected from at least three independent experimental sets. Error bars, S.D.; ns: p>0.05; *p≤0.05; **p≤0.01; ***p≤0.001, by Student’s t-test.
Figure 5—figure supplement 1. Kif2C depletion did not affect the expression of GFP-53BP1 (A).


