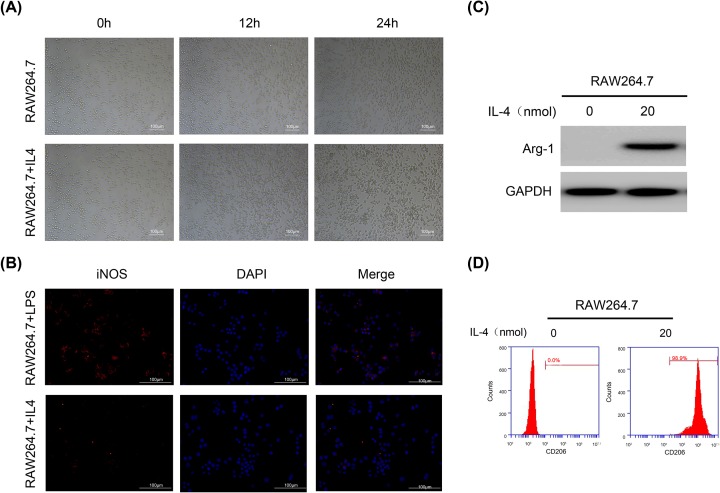
Figure 1. RAW264.7 macrophages were polarized to M2a macrophages and characterized.
(A) IL-4 induces morphological changes in M2a cells. (B) Western blot showing the Arg1 protein expression level. GAPDH was used as the loading control and for band density normalization. (C) Immunofluorescence showing the expression of the M1-type specific protein iNOS. (D) Flow cytometry analysis of the expression of the M2-specific protein CD206.

