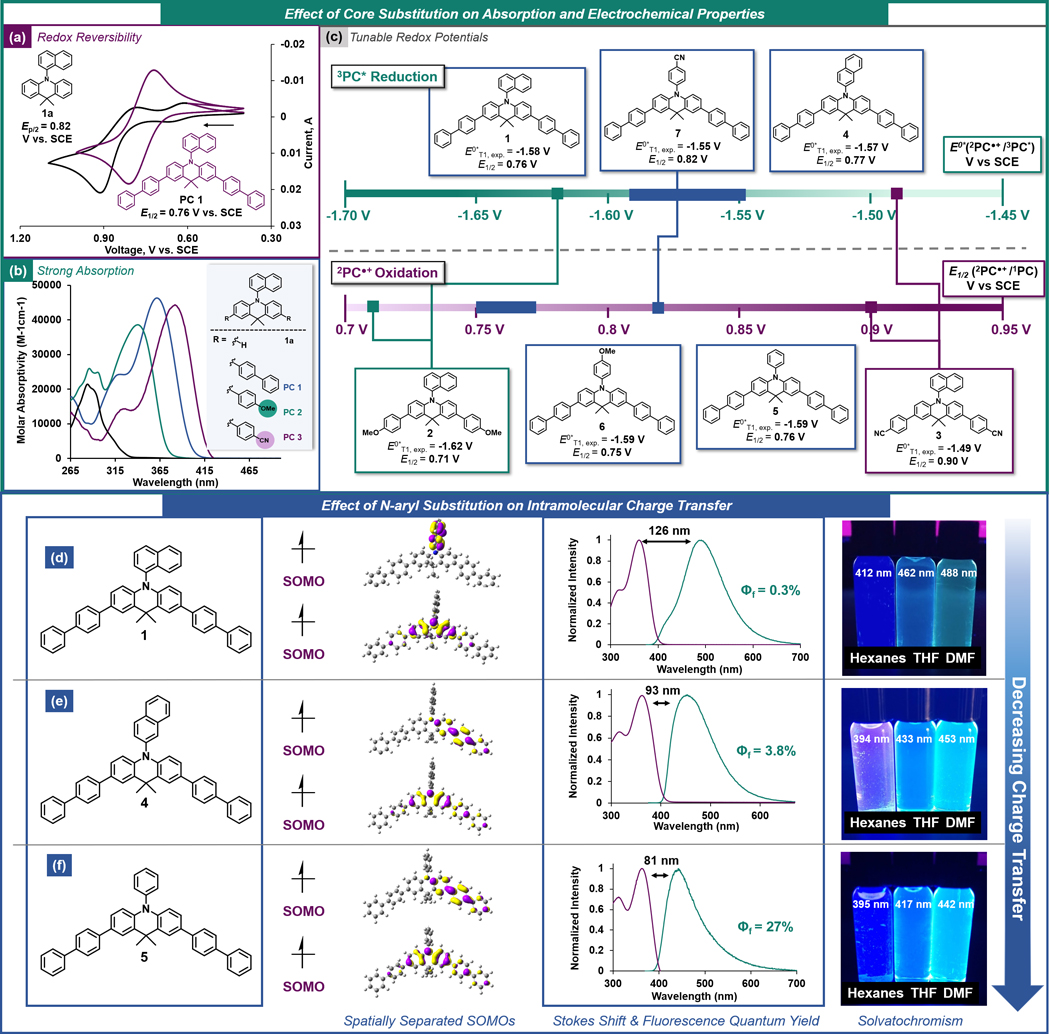
Figure 2.
(a) Cyclic voltammogram of PC 1a and PC 1. (b) UV-vis spectrum of PCs 1a, 1, 2, and 3. (c) Electrochemical series of experimentally-measured excited state redox potentials E0*T1, exp. = E0(2PC●+/3PC*) and oxidation potentials E1/2 (2PC●+/1PC) of PCs investigated in this study. High- and low-lying SOMO for PCs with electronically neutral N-aryl groups, overlays of the absorption profiles (purple) and emission profiles (teal) with the experimentally determined Stokes shifts for each PC, and photographs of the PCs dissolved in solvents with increasing polarity with λmax,emission for each solvent for PC 1 (d), 4 (e), and 5 (f). All CV, UV-vis, and emission data collected in N,N-dimethylformamide. See SI for full experimental and computational details.

