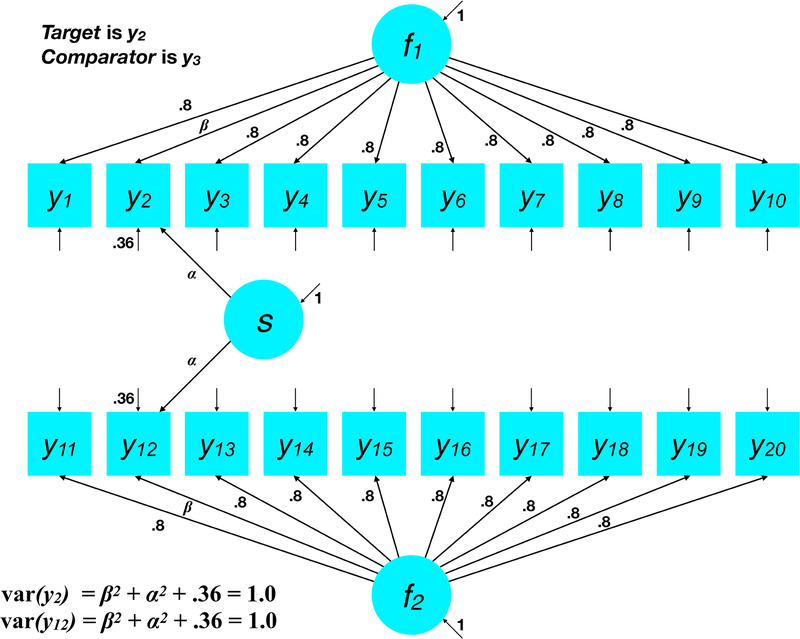
Figure 4.
The orthogonal factor model for Simulation 2. The association between y2 and y12 varied parametrically between r = 0 and r = 0.64 according to the loading, α, on the specific factor, s. Standardized loadings for all other indicators were fixed at 0.8, whereas loadings for y2 and y12 varied to hold constant the explained item variance across conditions.

