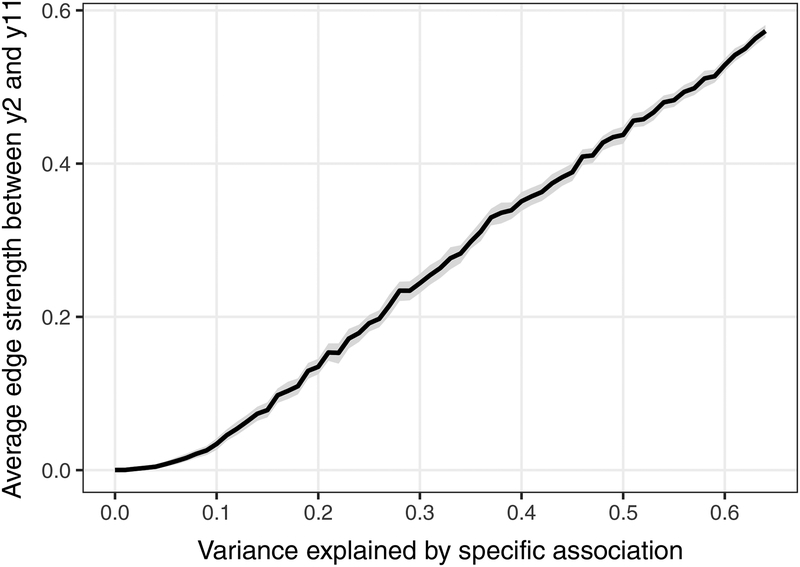
Figure 5.
Edge strength between correlated items as a function of variance explained by a specific bivariate association. In all conditions, 64% of the variance in y2 and y12 was accounted for by the model. When zero variance was explained by the factor (i.e., the factor loadings were zero for y2 and y11), all variance was explained by the unique (marginal) association. Conversely, when all variance was explained by the factor, y2 and y11 had no specific association. Lines denote the mean edge strength across the 100 replications of each condition. Gray ribbons around the lines denote the bootstrapped 99% confidence interval.

