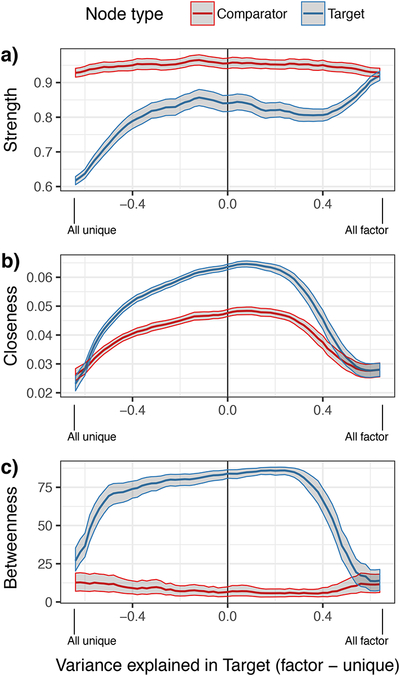
Figure 6.

Nodal graph metrics as a function of variance explained in the target nodes, y2 and y12, by common factor or unique sources (see Figure 4). Note that the scale of the y axis varies substantially across panels. The × axis represents difference in the variance explained by these sources, with the far left-hand side denoting variation completely due to a bivariate relationship between y2 and y12 (no factor effect). The far right-hand side denotes a condition in which all variation is due to common latent factors (no specific bivariate association). Lines denote the mean across replications within a condition; ribbons denote the 99% bootstrapped confidence limits of the mean. The target node depicts the effects of the simulation conditions on y2, whereas the comparator node depicts effects on y3, whose variance was not manipulated by the simulation.
