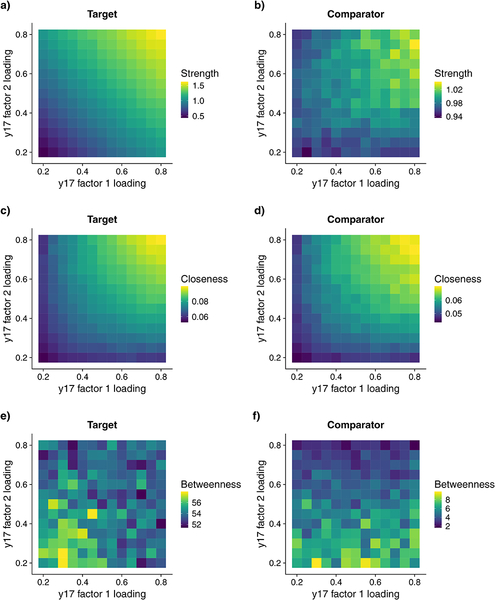
Figure 8.
The effects of independent latent causes on nodal graph metrics for target (y17) and comparator (y10) nodes. Data were generated from an orthogonal two-factor model in which the cross-loading of the target on the latent factors was independently manipulated between 0.2 and 0.8 (see Figure 7). Color tiles in each panel depict the mean graph metric value in that simulation condition (i.e., as a function of factor 1 and factor 2 loadings).

