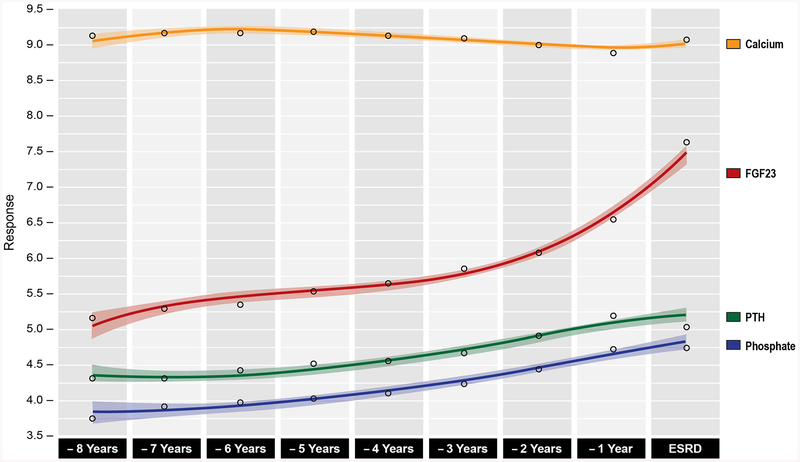
Figure 2. Population mean levels of mineral metabolites prior to ESRD onset.
Cubic spline smoothed population mean levels (with 95% confidence intervals) in ln(FGF-23) (red), ln(PTH) (green), phosphate (blue), and calcium (orange) levels prior to ESRD transition. Shaded areas represent 95% confidence intervals.

