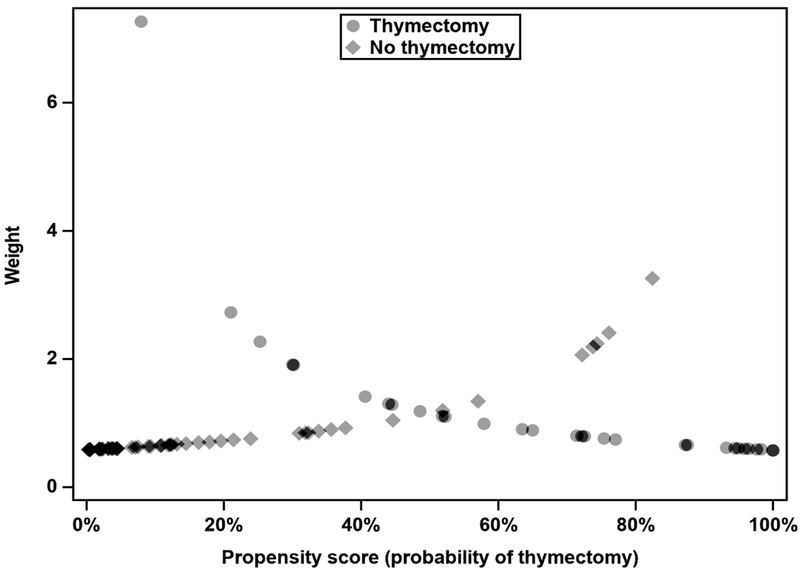
Figure 1:

Scatterplot of sample weighting by propensity score for thymectomy
Note that for predicted probabilities of thymectomy near 0.5, thymectomy and non-thymectomy patients have similar weights. At higher probabilities of thymectomy, non-thymectomy patients are up-weighted and thymectomy patients are down-weighted, and vice versa for lower probabilities of thymectomy.
