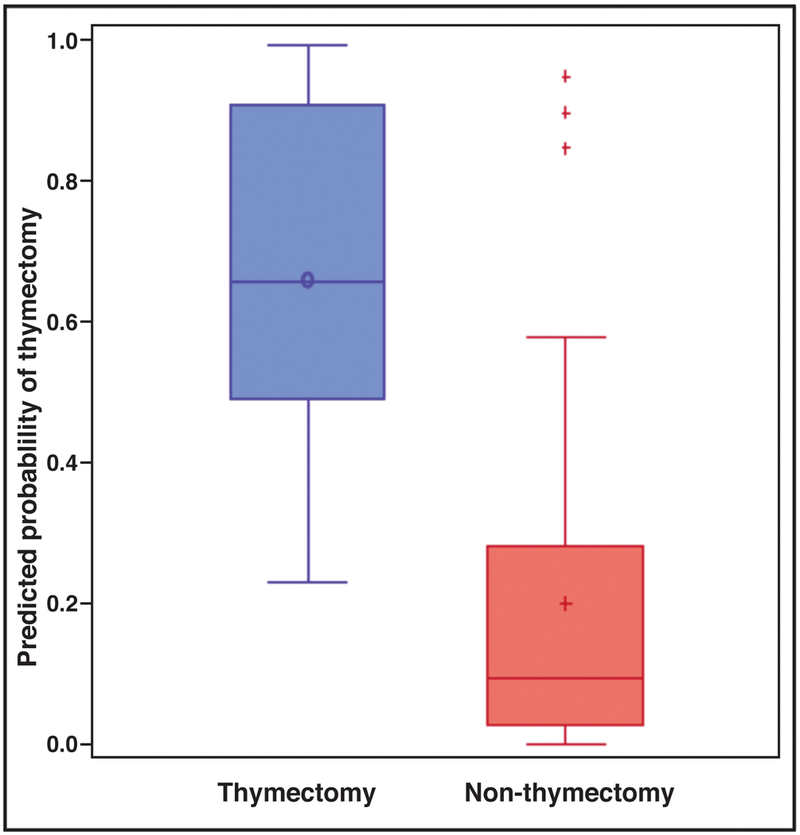
Figure 2:

Boxplot of predicted probability of thymectomy according to propensity score model
The horizontal line inside each box indicates the median, and the icon inside each box (hollow circle for thymectomy, plus-sign for non-thymectomy) indicates the mean.
