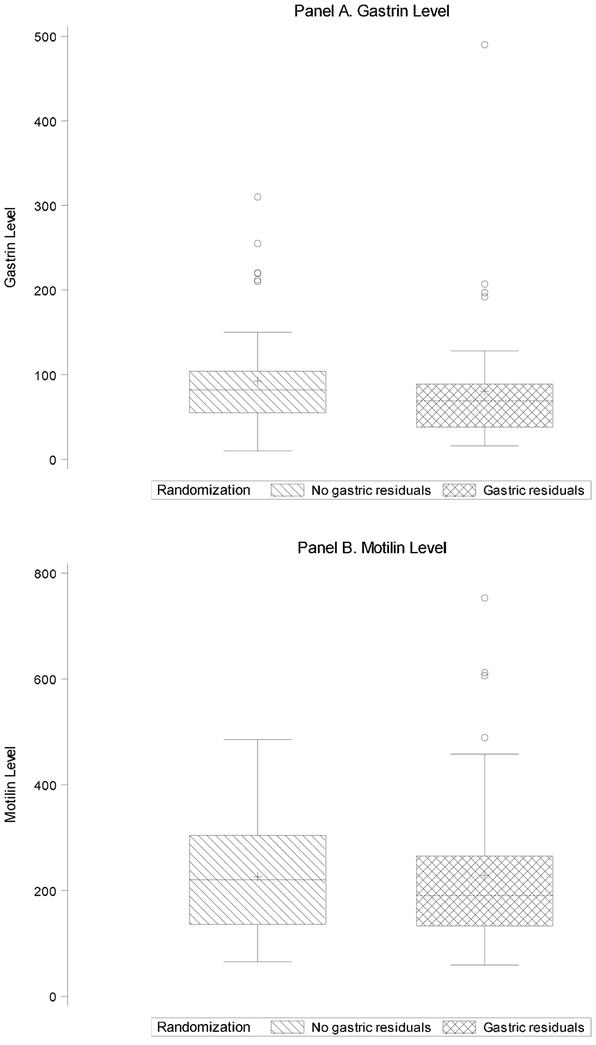
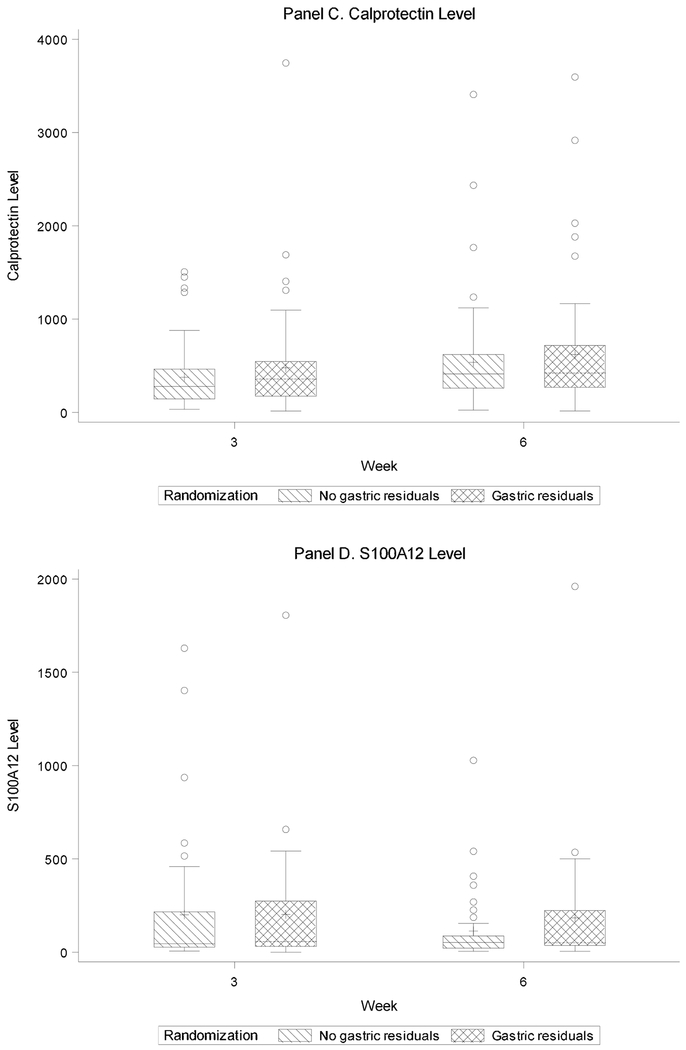
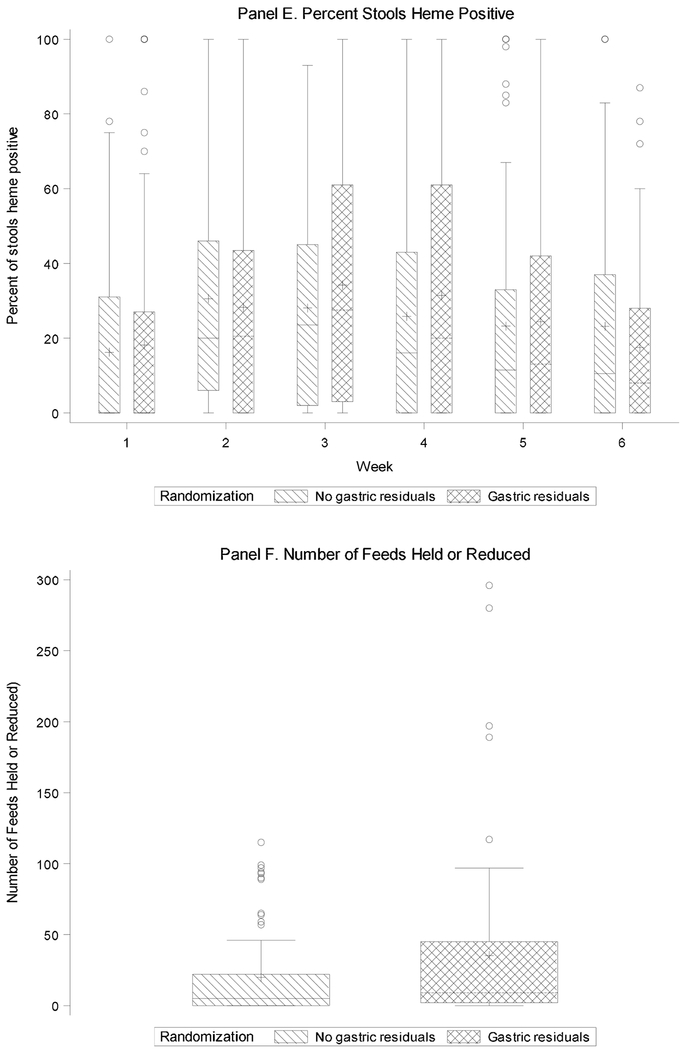
Figure 2.
Box plot panels for values for raw untransformed gastrin, motilin, calprotectin, S100A12, stools positive for occult blood and number of feeds held or reduced
NOTE: Bottom and top edges of the box are 25th and 75th percentile. Plus inside box indicates mean; line inside box indicates median. Whiskers indicate range of values outside intra-quartile range (IQR). Circles are outliers (greater than 1.5*IQR).


