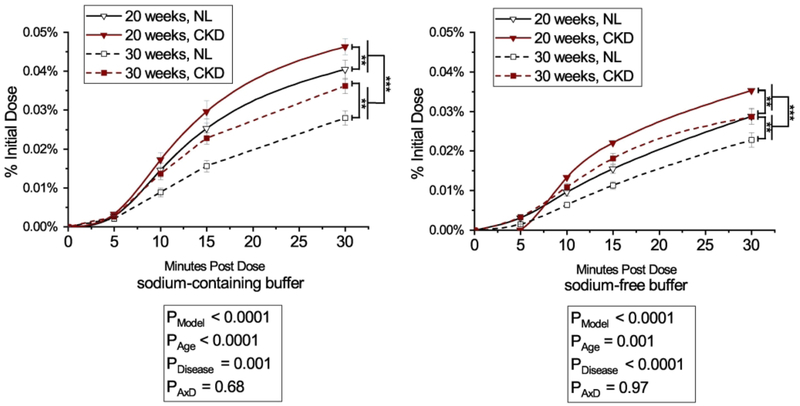
Figure 2.
Jejunal phosphorus absorption in plasma over 30 minutes by age (20- or 30-weeks) and disease (CKD or NL) with a sodium-containing absorption buffer (left) or sodium-free buffer (right). Phosphorus absorption from plasma was calculated as the area under the curve of the % of initial dose of 33P of each timepoint over the 30 minute test. Means and standard error bars are shown for each group. For rats given either the sodium-containing or sodium-free absorption buffer, there was a main effect for age where 20-week-old rats had higher absorption efficiency compared to both 30-week-olds, and CKD rats had higher balance compared to NL, with no significant age x disease interaction. Absorption with sodium-containing buffer (left): CKD rats are shown with black lines and black triangles, NL rats are shown with dashed lines and white squares. Absorption with sodium-free buffer: CKD rats are shown with black lines with black triangles, NL rats are shown with dashed lines with black dashes and white squares. ANOVA p-values for the overall model (PModel), main effect of age (PAge), main effect of disease (PDisease), and interaction of age and disease (PAxD) are shown. n=24 NL, n=24 CKD for sodium-containing buffer; n=24 NL, n=23 CKD for sodium-free buffer, ** p < 0.01, *** p < 0.0001.

