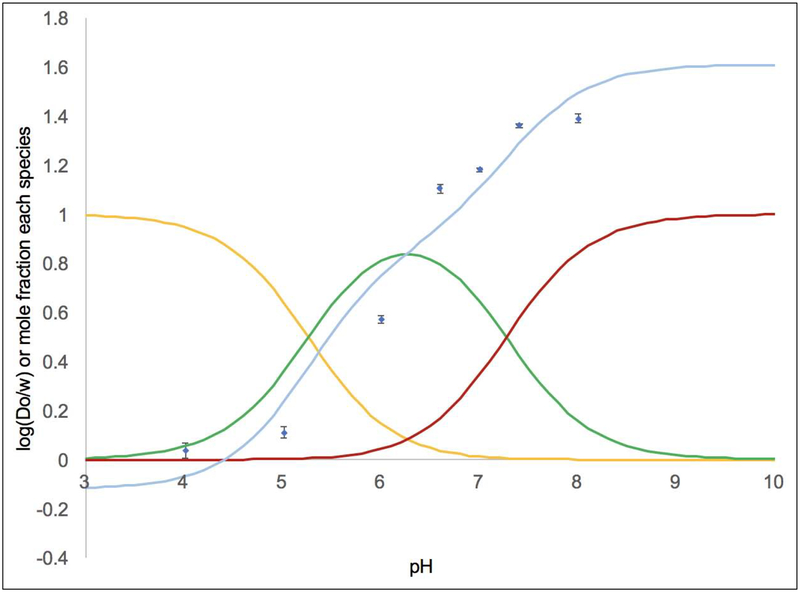
Figure 2.
Log(Do/w) as a function of pH data for 1 is shown by the blue diamonds with error bars. The pKa values were used to calculate the proportion of the diprotic acid 1A (shown in yellow), the monoprotic species (in green), and the conjugate base 1B (in red). The curve fit in light blue shows that predicted Log(Do/w) values of −0.1 for 1A, 0.9 for the monoprotic species, and 1.6 for 1B produce a satisfactory fit. To generate the fit, the Log(Do/w) values for these species were empirically varied until the predicted Log(Do/w) (as a weighted average considering the proportion of each species and its Log(Do/w) value) closely matched the observed Log(Do/w) at each pH.

