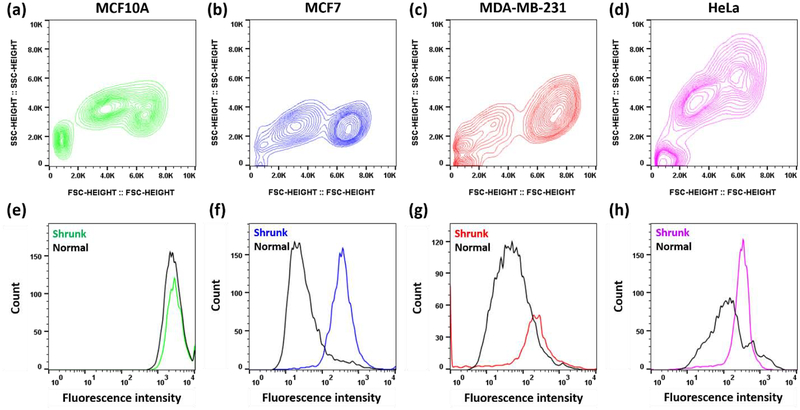
Figure 5.
MCF10A, MCF7, MDA-MB-231, and HeLa cells were administered with 50 μM of 3A and were studied by flow cytometry. (a – d) Flow cytometry contour plots of cell size and granularity were detected using forward scatter (FSC) and side scatter (SSC), respectively. Cell debris was detected at bottom left corner for all cell lines (≤ 2.0K SSC, ≤ 2.0K FSC). The population on the left indicates cells with smaller sizes, i.e., shrunk cells (FSC 2.0K-4.0K), whereas the population on the right indicates cells with normal sizes (FSC ≥5.0K). (e – h) Flow cytometry histogram analysis shows fluorescence intensity which is proportional to the Ru concentration. Shrunk and normal cells correspond to the same populations from a-d.

