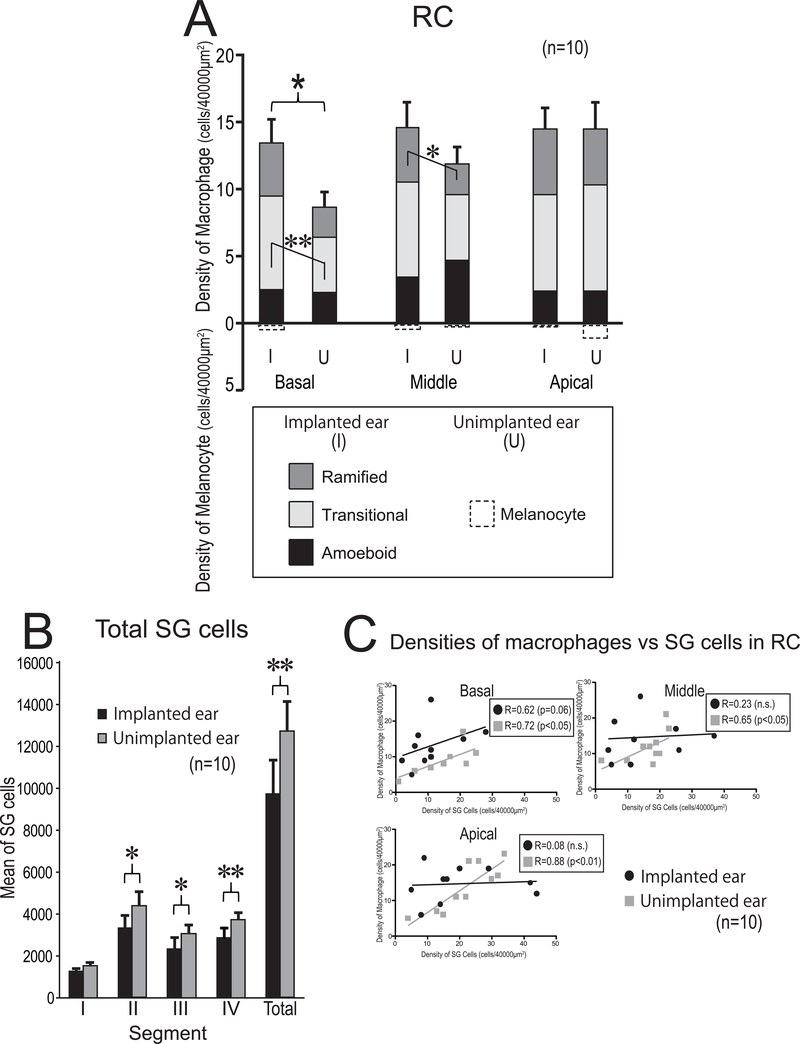
Figure 4. Density and phenotype of macrophages (A), SG cell counts (B), and Correlation between macrophages vs SG cells (C).
(A) The mean densities of macrophages and melanocytes in three segments of RC (basal, middle, apical turn) of implanted (I) and unimplanted (U) ears. A paired-t test or Wilcoxon matched-pairs signed rank test was used for statistical analysis between I and U ears. The asterisks (*) or (*) indicate the statistical significance in total density (*: p < 0.05) or in phenotype of macrophage (*: p < 0.05, **: p < 0.01), respectively.
(B) The mean of total and segmental SG cell counts in 10 cases. The error bars indicated the standard errors. Black and gray column indicate implanted and unimplanted ears, respectively. The asterisks (*) indicate the statistical significance between implanted and unimplanted ears (*: p < 0.05, **: p < 0.01, paired-t test or Wilcoxon matched-pairs signed rank test).
(C) Correlation between densities of macrophages vs SG cells. Scatter plot of densities of macrophages verses SG cell in three segments of RC are shown. Black circles and gray squares indicate implanted and unimplanted ears, respectively. (Pearson’s or Spearman’s coefficients of correlation test).

