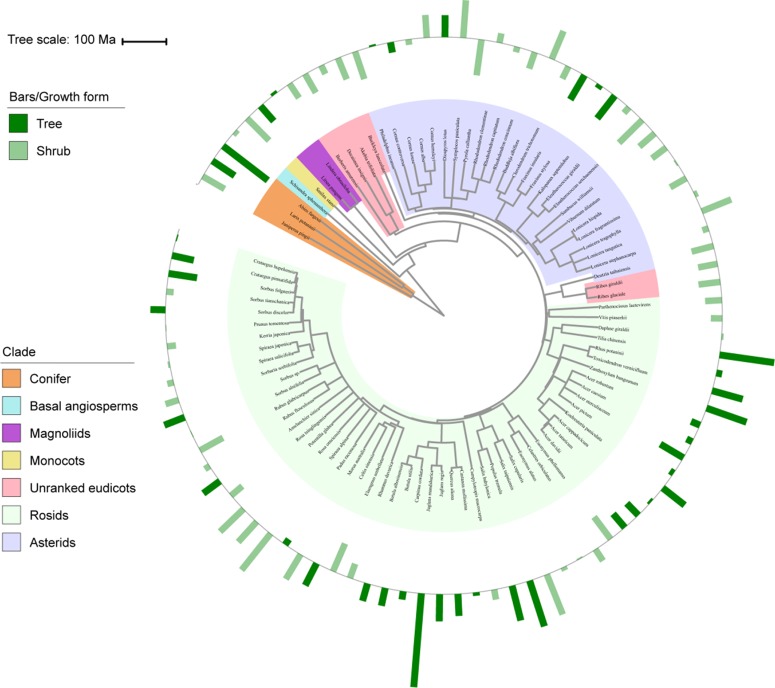
Figure 1.
Variation in vein density (VD) with plant phylogeny and growth form. Bars represent standardized values for VD, with outward and inward bars representing values above and below the mean, respectively, and colors representing different growth forms. Branch colors in phylogeny represent main phylogenetic clades. Ma, million years ago.

