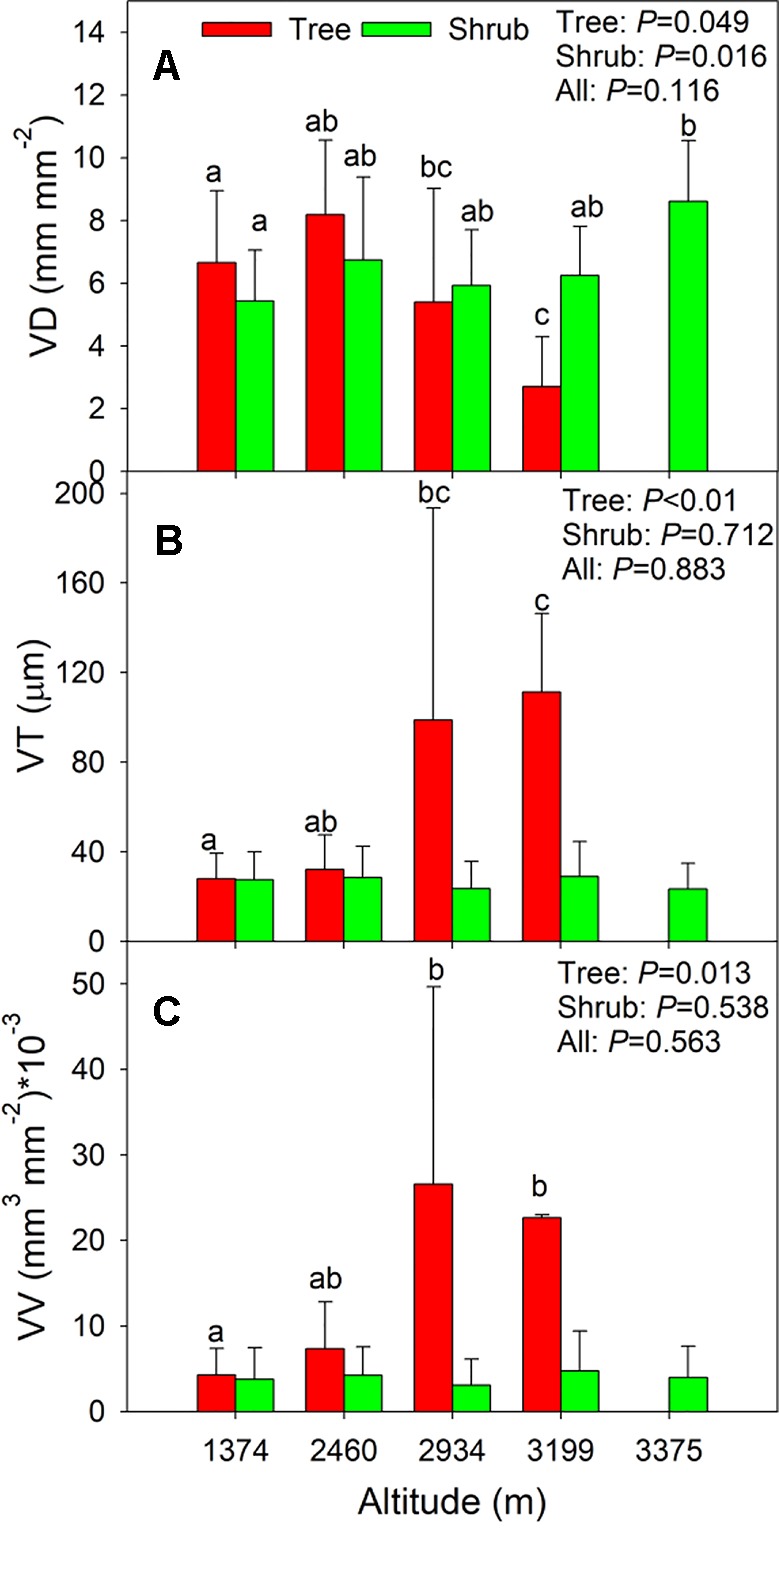
Figure 4.

(A–C) Shows the changes in vein traits along the altitude for all species, trees, and shrubs. Error bars represent standard deviation. Different letters in each growth form indicate significant differences among altitudes (P <0.05). Trait abbreviations are provided in Table 1 .
