Figure 5.

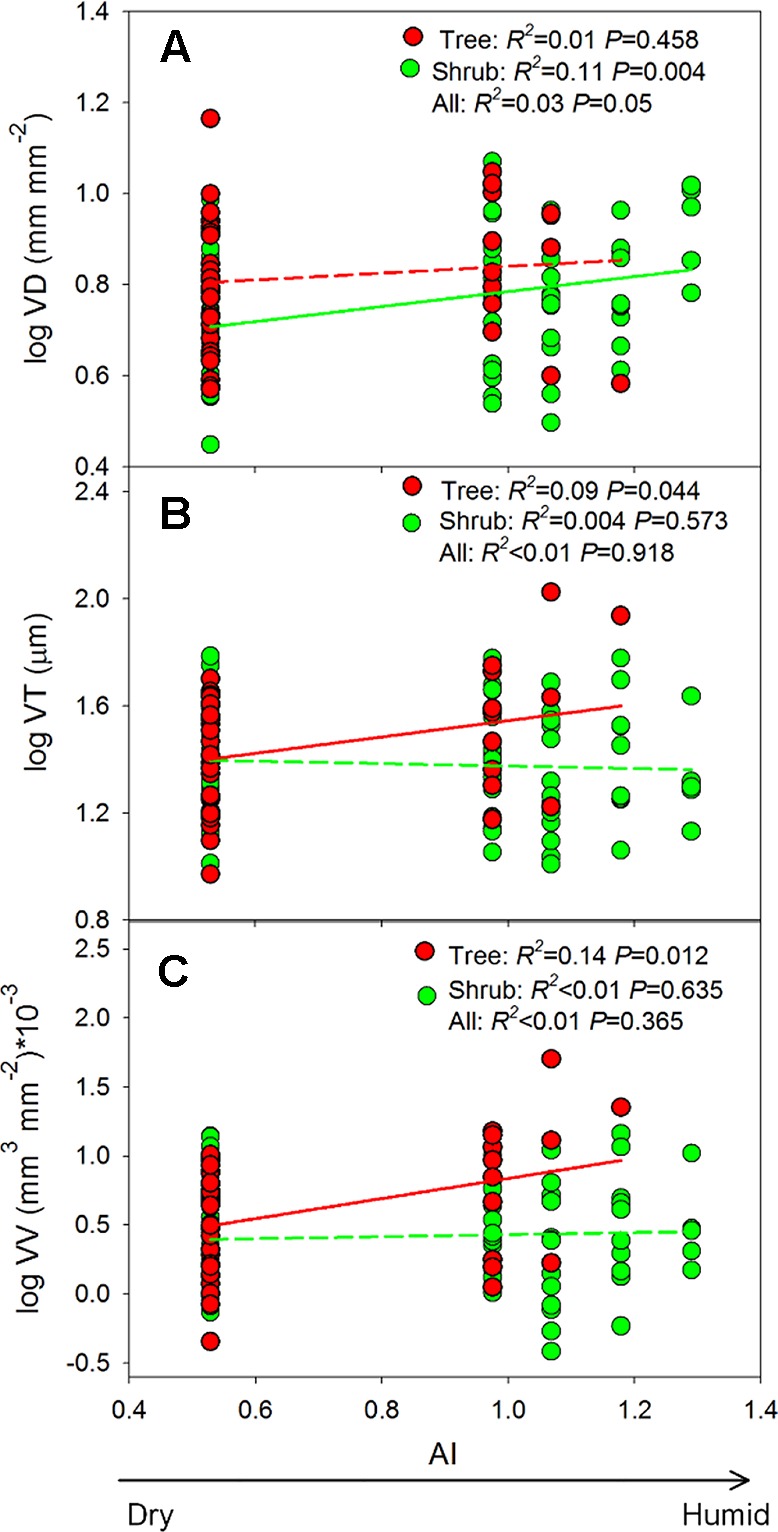
(A–C) Shows the changes in vein traits along the aridity gradient. AI, aridity index. Insignificant regression lines are shown in dotted lines (P > 0.05). Trait abbreviations are provided in Table 1 .

(A–C) Shows the changes in vein traits along the aridity gradient. AI, aridity index. Insignificant regression lines are shown in dotted lines (P > 0.05). Trait abbreviations are provided in Table 1 .