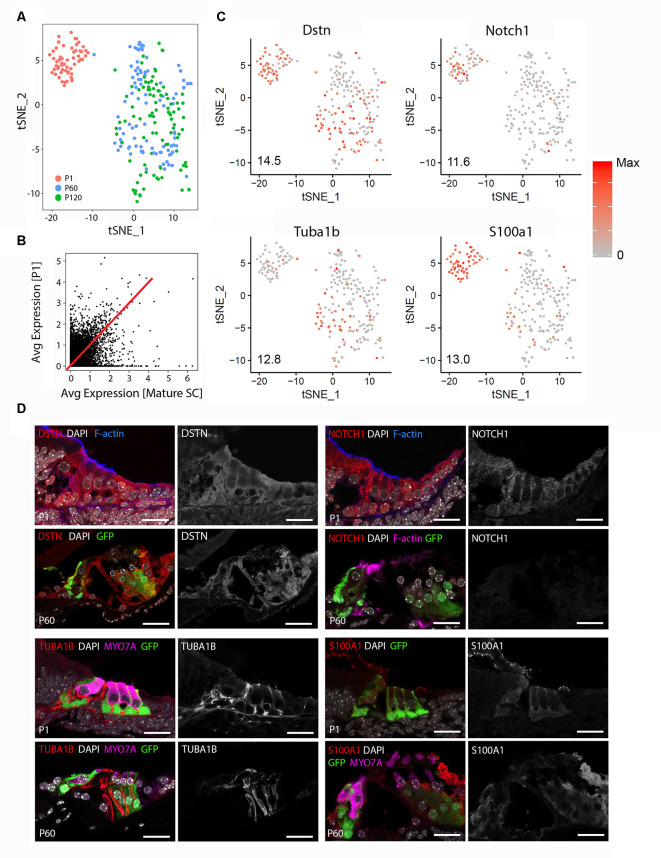
Figure 1.
Adult cochlear supporting cells (SCs) are transcriptionally distinct from perinatal cochlear SCs. (A) Unbiased clustering of FACS-purified P1 and mature (P60, P120) cochlear SC transcriptomes demonstrates the clustering of single cells based on the transcriptional expression profiles for each cell. Note that P1 and mature cochlear SCs cluster within their respective groups but exhibit distinct clustering from each other. (B) Comparison of averaged gene expression between FACS-purified mature (P60, P120) and P1 cochlear SCs indicates both equivalent (genes expressed on or near the red line) and differential (genes located closer to either axis) expression between the two cell stages. (C) Feature plots of select known cochlear SC genes (Dstn, Notch1, S100a1, Tuba1b) demonstrate distinct differences between P1 and mature cochlear SCs. An expression is shown in log2 [nTPM] with the maximum expression value (Max) shown in the lower-left corner of each plot. The expression histogram is shown with red indicating higher expression. (D) Representative immunohistochemistry validating transcriptional differences between P1 and mature cochlear SCs in the organ of Corti from LfngEGFP mice. Each 4-panel grouping demonstrates P1 and P60 immunohistochemistry with the protein of interest in the red channel (left panels) at P1 (upper left panel) and P60 (lower left panel) and the gray scale single-channel images of the protein of interest (right panels) at P1 (upper right panel) and P60 (lower right panel). Known protein expression (DSTN, NOTCH1, S100A1, TUBA1B) is demonstrated (Upper left Four panels and proceeding clockwise). Staining for F-actin or MYO7A identifies hair cell (HC) stereocilia or HCs, respectively. Scale bar, 20 μm.

