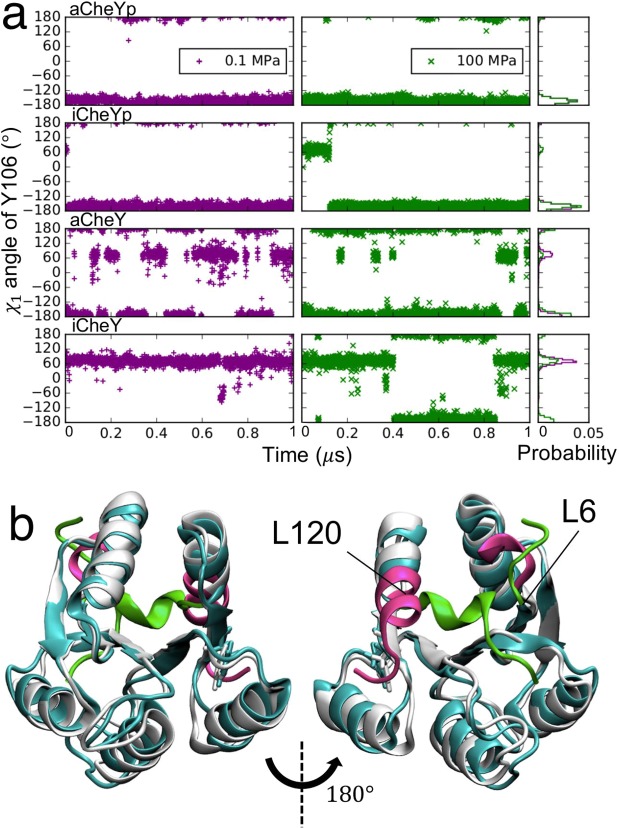
Figure 2.
Pressure effects on the CheY monomer. (a) Time evolution of the χ1 angle of Y106 during the 1-µs MD simulations for four different models of CheY at 0.1 (purple) and 100 MPa (green). Probability densities are shown on the right. (b) Representative structures of aCheYp at 0.1 (white) and 100 MPa (cyan). A view from the opposite side is shown on the right. Segments significantly affected by pressure are shown in a different color, with the structures at 0.1 and 100 MPa indicated in magenta and green, respectively. Residues on the edges of the segments that underwent conformational transitions are labeled. The representative structures were determined as cluster centers by the k-means clustering of the last half of the MD trajectories.

