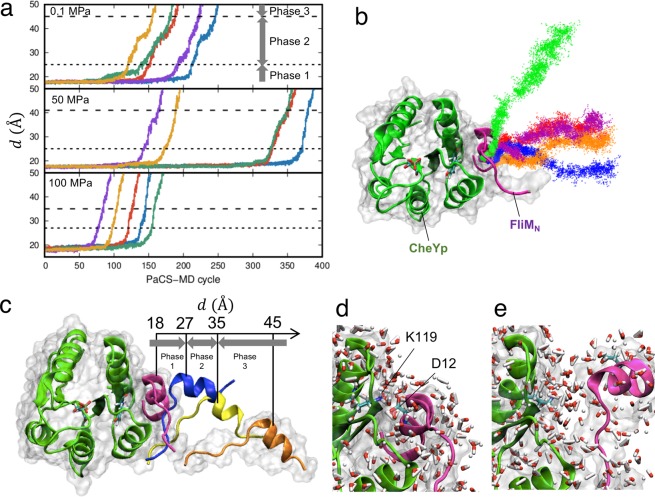
Figure 3.
Dissociation of the CheYp–FliMN complex at 0.1, 50, and 100 MPa, as simulated by PaCS-MD. (a) The inter-COM distance between CheYp and FliMN, with d indicated as a function of the PaCS-MD cycle at 0.1 (top), 50 (center), and 100 (bottom) MPa. Five independent PaCS-MD simulations are shown in different colors. The broken lines indicate the borders between Phases 1–2 and 2–3. (b) COM positions of FliMN obtained by PaCS-MD and all additional MD simulations at 100 MPa. Color differences denote different trials. (c) Examples of snapshots of FliMN during a dissociation at 100 MPa. MD snapshots with four different d values are shown in different colors after superimposing CheYp. Molecular surfaces of the initial and last snapshots are shown in transparent colors. (d,e) Closeup view of the interface, (d) before the breakage of the key salt bridge (Lys119: CheY‒Asp12: FliMN) at d = 18 Å, and (e) just after the detachment of the FliMN helix at d = 27 Å at 100 MPa. Water molecules in the first hydration shell of each protein are shown with stick models and atomic-color basis.

