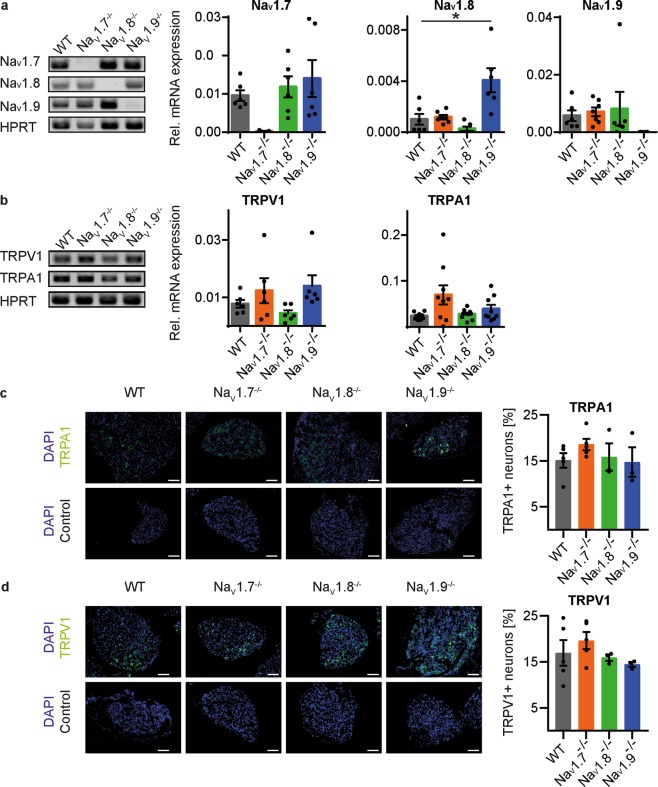
Figure 5.
Expression of NaV and TRP channels in dorsal root ganglion neurons of NaV1.7−/−, NaV1.8−/−, NaV1.9−/− and wild type mice. (a,b) Relative mRNA expression compared to HPRT and respective agarose gels of amplified PCR products for NaV, TRPA1 and TRPV1 channels. error bars: s.e.m, *P < 0.05 (c,d) Representative and quantitative immunohistochemistry of TRPA1 and TRPV1 expression, n = 3–5 (average from 4–7 slices per animal), error bars: s.e.m, scale bar: 100 µM.

