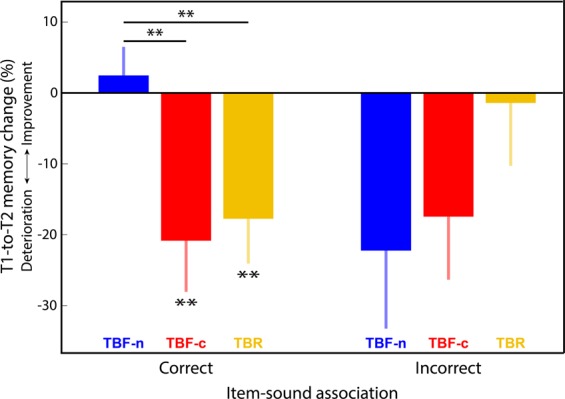
Figure 3.

The detrimental effect of TMR was limited to the items correctly associated with the sounds. Bars show the percentage change from T1 to T2 for TBF-n (blue), TBF-c (red), and TBR (yellow) images. Negative values represent memory deterioration over sleep. Bars at left show results for images with correct sound associations; bars at right show results for images without correct sound associations. Error bars represent standard errors of the mean. **p < 0.01.
