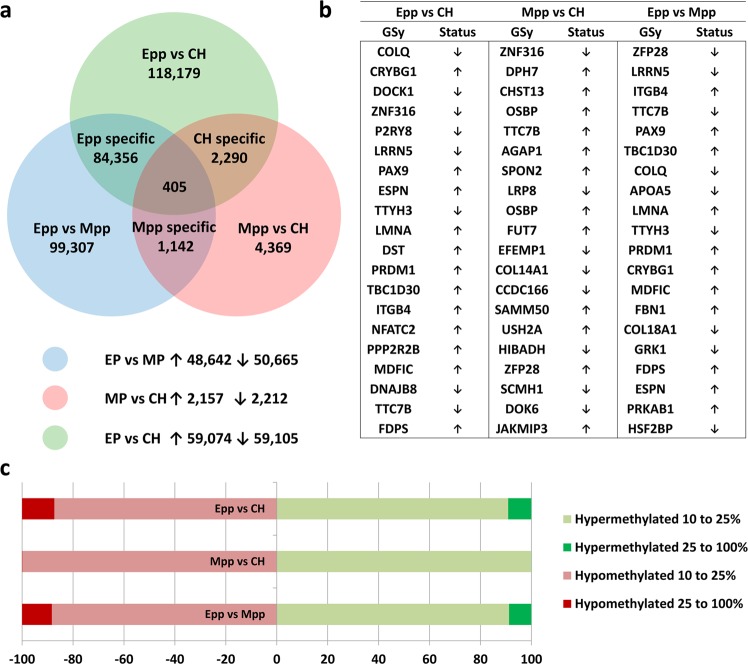
Figure 4.
DNA methylation analysis of oocytes derived from early-postpartum (Epp), late postpartum (Lpp), and cyclic heifers. (a) Venn diagram of DMRs obtained by logistic regression (10% methylation difference, adjusted p < 0.05), with number of hyper- and hypo-methylated DMRs in each comparison, where 405 DMRs were found to be shared across all conditions (center). (b) Top 20 differentially methylated regions overlapping gene (GSy = gene symbol) body regions and their methylation changes in all three comparisons. (c) Fold methylation changes found in hyper- (right) and hypo-methylated (left) DMRs from pairwise comparisons.

