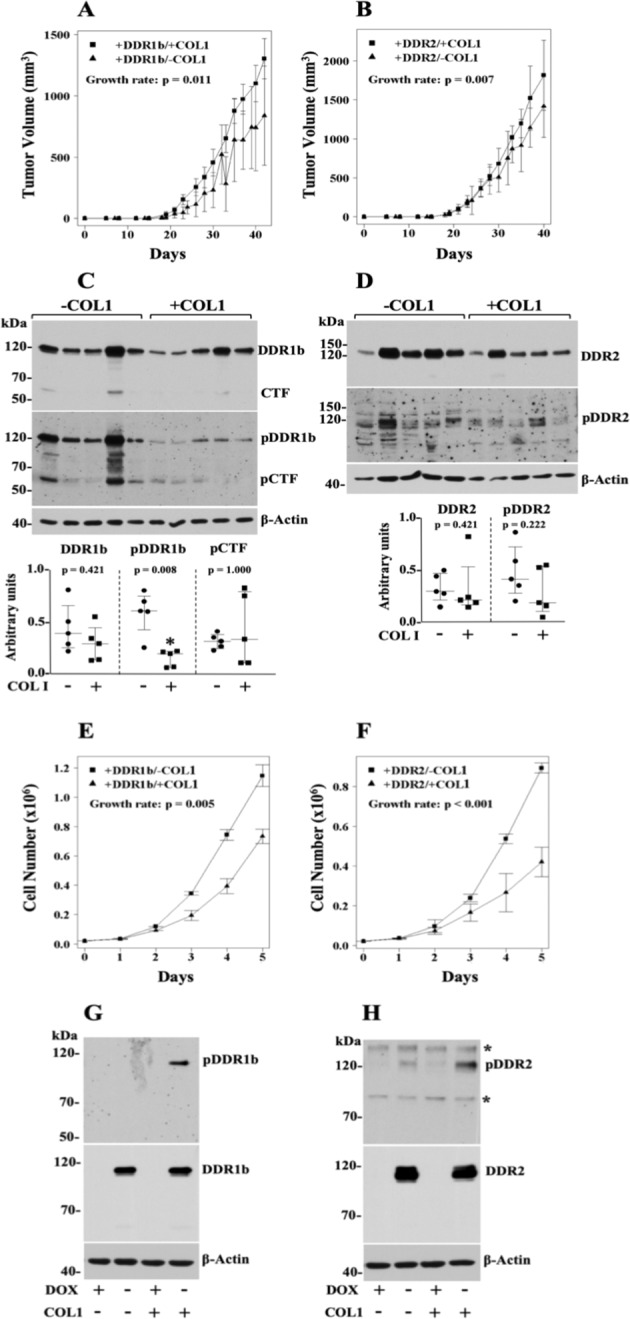
Figure 4.

DDRs promote HT1080 tumour growth rate only when cells are co-inoculated with COL1. (A,B) Volumes of +DDR/±COL1 tumours as a function of time. HT-DDR1b (A) and HT-DDR2 (B) cells were incubated for two days without DOX to induce DDR1b or DDR2 expression. Then, the cells were harvested, and a fraction of the cells was mixed with an ice-cold solution of rat-tail COL1 (2 mg/ml, final concentration) whereas the other fraction was mixed with serum-free media. Mice fed a regular diet, were subcutaneously inoculated with 100 μl of the cell suspension (with or without COL1) containing 1 × 10⁶ cells. Number of mice for each group is provided in Supplementary Table 1. Tumours were measured every 2–3 days, and tumour volumes were calculated. Tumour growth rates were determined, as described in the Methods section. Note: The +DDR/−COL1 groups here are the+DDR groups plotted in Fig. 2A,B, and the +DDR/+COL1 groups are also plotted in Fig. 3A,B. (C,D) Expression and activation of DDRs in +DDR/±COL1 tumour extracts. Tumour extracts of +DDR1b/±COL1 (C) and +DDR2/±COL1 (D) tumours (n = 5 for each group) in RIPA buffer were resolved by reducing SDS-PAGE followed by immunoblot analyses using antibodies against phosphorylated DDR1b (Y513) (C, middle panel) or DDR2 (Y740) (D, middle panel). The blots were then stripped and reprobed with antibodies to total DDRs (upper panels), and then reprobed for β-actin as loading control (lower panels). Blots were quantified as described in the Methods section. Scatter plots show median with interquartile range where each dot represents an individual tumour. Mann-Whitney U test was performed for statistical analyses. Full-length blots are presented in Supplementary Fig. 12. (E,F) In vitro cell proliferation of +DDR-expressing HT1080 cells in 2D COL1 vs. plastic. HT-DDR1b (E) and HT-DDR2 (F) cells were incubated without DOX for 3 days and then 2 × 10⁴ cells/well were seeded on 24-well plates coated with or without fibrillar COL1 (100 μg/well), in triplicates, in complete media. At various time points, the cells were detached and counted with a Coulter counter. Results represent the average of three independent experiments and data plotted as described in Methods. Note: The +DDR/−COL1 groups here are the +DDR groups plotted in Fig. 2E,F, and the +DDR/+COL1 groups are also plotted in Fig. 3E,F. (G,H) Expression and activation of DDRs in HT1080 cells ±DDRs cultured for 5 days in 2D COL1 or plastic. HT-DDR1b (G) and HT-DDR2 (H) cells were incubated for three days with (+) or without (−) DOX to repress or induce DDR1b or DDR2 expression, respectively. Then, 2 × 10⁴ cells/well were seeded on 24-well plates, on uncoated wells (−) or wells coated with fibrillar COL1 (100 μg/well) (+), in triplicates. The cells were then cultured in complete media for 5 days, and then lysed in RIPA buffer. Equal protein amounts per lane (20 µg) were resolved by reducing 7.5% SDS-PAGE followed by immunoblot analyses using antibodies to phosphorylated DDR1b (Y513) (pDDR1) or DDR2 (Y740) (pDDR2). The same blots were then stripped and reprobed with antibodies against total DDRs (middle panels), and against β-actin, as loading control (lower panels). Asterisks indicate non-specific bands. Full-length blots are presented in Supplementary Fig. 12.
