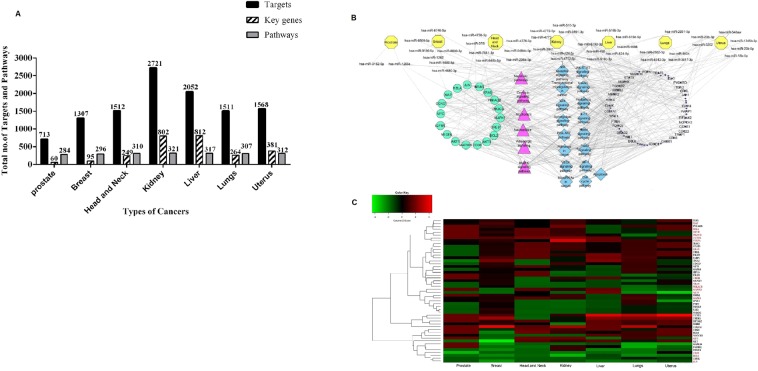
Figure 6.
(A) A comparative analysis of targets and pathways regulated by unique miRNAs. The bar graph represents the total number of targets and the total number of pathways regulated by unique miRNAs from each cancer types along with the key genes. (B) Regulatory network of unique miRNAs. The Cytoscape network illustrates the interaction of each unique miRNAs specific for each cancer type (represented in yellow). The key genes and pathways, which are common for both unique and common miRNAs, are indicated in cyan and pink. The key genes and pathways that specific for unique miRNAs are indicated in blue and black colours. (C) Heatmap of differentially expressed key genes of unique miRNAs in the various cancer types. The panel shows down-regulated key genes in green and up-regulated key genes in red. Each row represents the key genes whereas each column represents cancer types. The key genes labelled in red are the common key genes between unique and common miRNAs.

