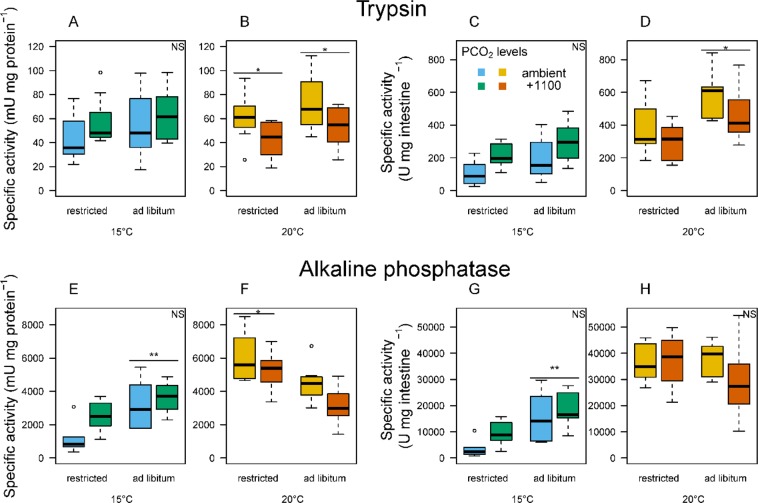
Figure 5.
Box and whisker plots (n = 8) of specific activities of digestive enzymes of fish reared at two temperatures according to PCO2 levels and feeding levels94. Results are given in milli-units per mg of protein (mU mg protein−1) for specific activity and in units per mg of intestine segment (U mg intestine−1) for total activity. Stars denote significant differences (ANOVAs, * < 0.01, ** < 0.001). The whiskers denote the 10th and 90th percentiles, the box denotes the 25th and 75th percentiles, the median value is shown (horizontal line) as well as outliers (points).

