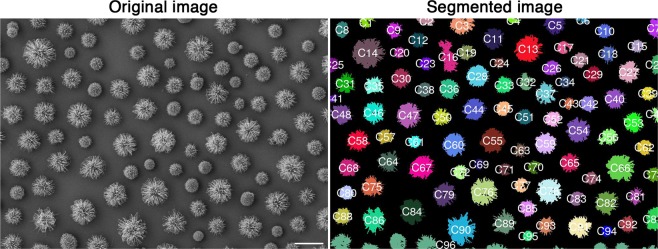
Figure 2.
Illustration of image segmentation from a SEM image. The colors were randomly chosen to represent the distinct objects detected by EBImage. Unique identifiers are assigned to each object, and those were used for posterior manual labeling. Note that most cells are well distinguished, although marginal objects tend to be merged together, as illustrated by C96 at the very bottom. These merged cells, as well as other non-cellular objects, were all treated as artifacts. Cells that were not displayed entirely in the field of view such that no visual classification was possible were considered unidentified. Scale bar: 10 μm.

