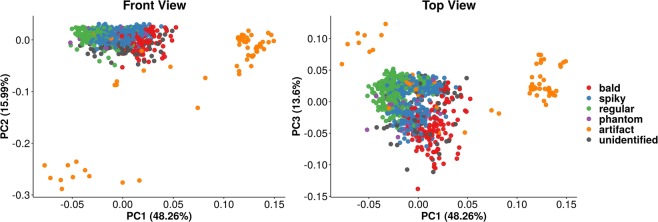
Figure 3.
PCA of SEM image data. Each point represents a single cell, each color represents a given label: bald (red), regular (green), spiky (blue), phantom (purple), artifact (orange) or unidentified (grey). The left chart shows PC1 and PC2, resembling a “front view” of PCA. Bald, spiky, and regular cells show grouping patterns, although artifacts differ greatly. Unassigned cells appeared well distributed all over labeled cells, which indicates they may belong to any morphotype. The right chart shows a “top view”, confirming the previous observations.

