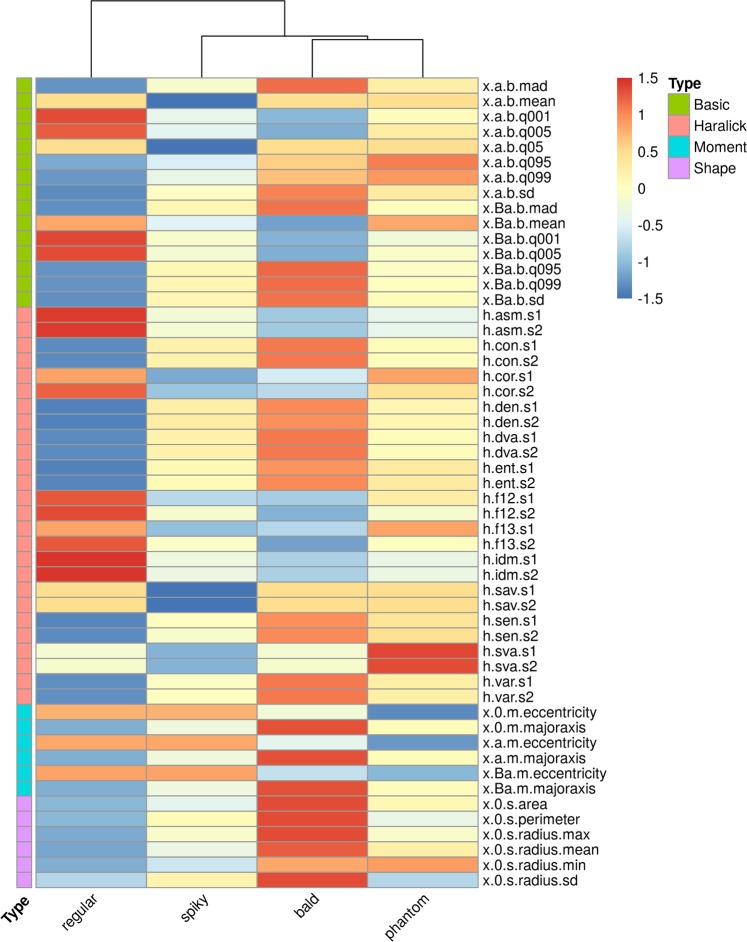
Figure 5.
Capsular morphotypes differ significantly in intensity, shape, moment, and texture. We estimated the expected value (mean) for each cell morphotype across all features using robust regression. The scaled values are represented as color intensities, i.e., the greater the intensity, the greater a given cell type differs from the cross-group average for the corresponding feature. Non-significant regression coefficients were set to zero and in these cases the resulting color corresponds to the baseline (estimate for regular morphotypes). Near-zero values mean the cell morphotype was close to the cross-group average.

