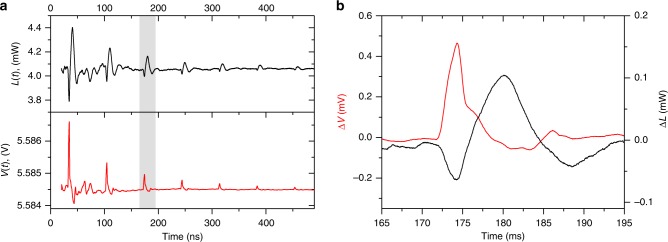
Fig. 2. Observation and measurement of the acoustic modulation on the QCL device.
a Temporal response of the THz emission, L(t), (black trace, top) and QCL voltage, V(t), (red trace, bottom) to incident strain pulses generated with an optical pulse energy of 10 µJ at a QCL bias Vb = V3. The initial strain pulse, arriving at time t = 32 ns, is generated by laser impact on the Al-film transducer at t = 0 and the following pulses, occurring every 70 ns, are due to multiple reflections in the device. b Shows the change in the L(t) and V(t) responses (ΔL and ΔV, respectively) to an individual acoustic pulse for the region highlighted in (a). Data have been smoothed using a 20-point rolling average filter. Source data are provided as a Source Data file.

