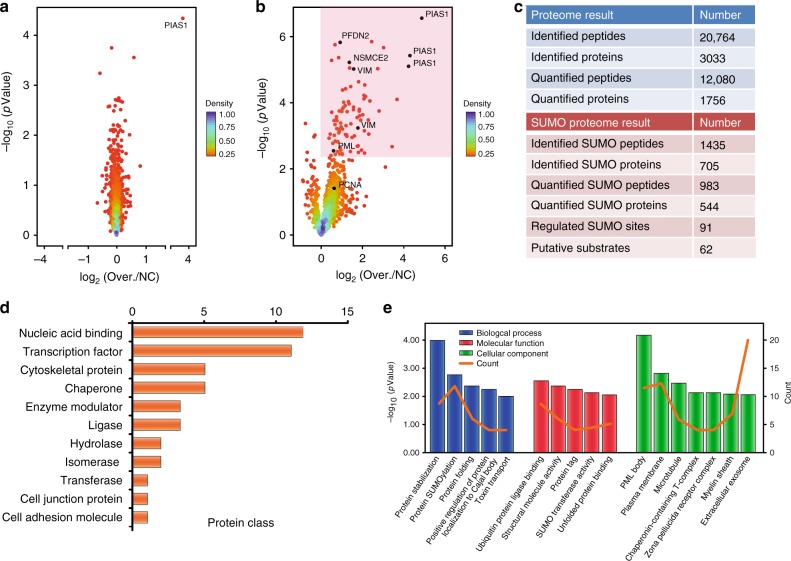
Fig. 3. Mass spectrometry results and bioinformatic analyses of identified PIAS1 substrates.
a Volcano plot showing the global proteome changes in cells overexpressing PIAS1 (Over.) vs. control cells (NC). Individual proteins are represented by points. b Volcano plot showing the global SUMOylation changes in cells overexpressing PIAS1 (Over.) vs. control cells (NC). Individual SUMOylation sites are represented by points. The area of the volcano plot where SUMO sites are significantly upregulated (Benjamini–Hochberg corrected p-value of <0.05) is shaded in pink. c Summary of identified and quantified peptides and proteins in both the proteome and SUMOylome experiments. d Functional classification of PIAS1 substrates using PANTHER (Protein Analysis Through Evolutionary Relationships) (http://www.pantherdb.org). e GO term enrichment distribution of the identified PIAS1 substrates using DAVID 6.8 (https://david.ncifcrf.gov/). Source data are provided as a Source Data file.

