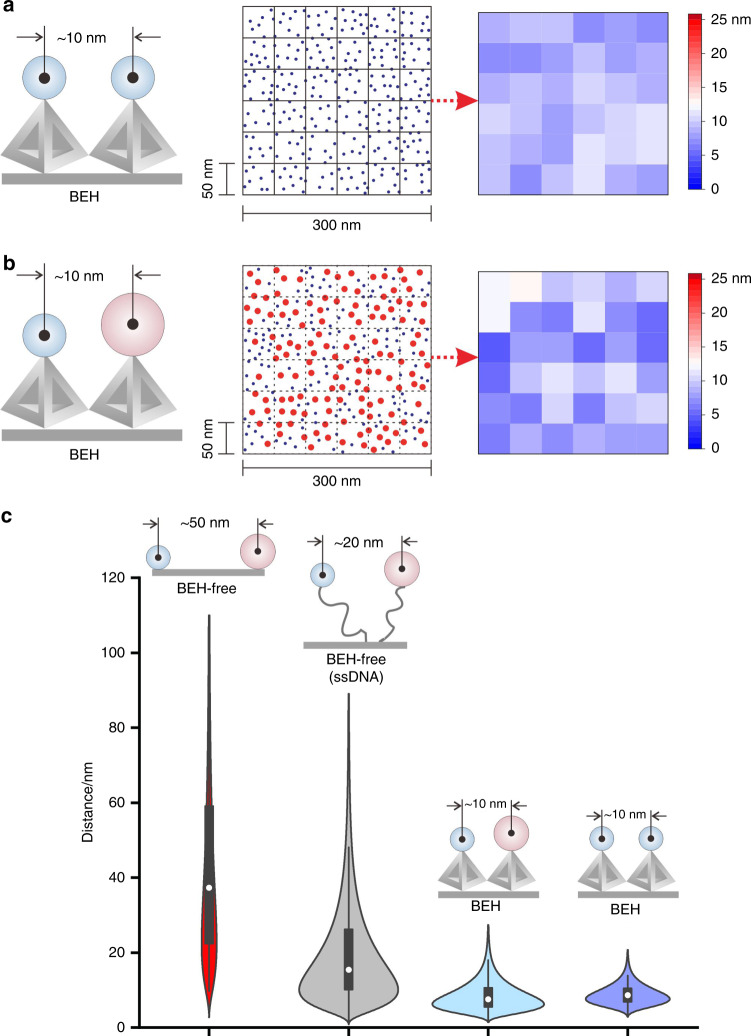
Fig. 2. Comparison of the inter-particle distance-controllability.
a The scheme and the locations (blue dots) of the assembled AuNPs (5 nm in diameter) on gold surface (from SEM image) by using BEH strategy. We measured the inter-particle distance of a representative region with 300 × 300 nm, by dividing the region into a 6 × 6 matrix. The heatmap demonstrated the average inter-particle distance of each square (50 × 50 nm region) in the matrix. The average inter-particle distance for the whole area is 9.1 ± 2.8 nm. b The scheme and the locations (blue and red dots) of the assembled AuNPs (5 nm and 10 nm in diameter) on gold surface (from SEM image) by using BEH strategy. Red dots indicate AuNPs of 10 nm; Blue dots indicate AuNPs of 5 nm. The inter-particle distance of AuNP hetero-pairs was measured. The inter-particle distance obtained by the BEH strategy with TDN of 17 bp was ~8.5 ± 3.8 nm. c The distribution of inter-particle distance obtained with BEH and BEH-free strategies (naked gold surface and ssDNA modified surface). The inter-particle distance obtained by BEH-free strategies (~49.7 ± 25.6 nm for naked gold surface and ~19.3 ± 12.2 nm for ssDNA modified surface) were significantly larger than 10 nm. In the boxplots the white dots represent the median value, the up and down bounds of box represent the first quartile and third quartile values and the vertical black line represent the whisker. The sample size used to derive statistics in c is 18, 118, 133, and 100, respectively. Source data are provided as a Source Data file.

